Maleyanda Arun Poovaiah, a Badminton player of International repute, was felicitated by the organisers of Tambaram Badminton Premier League (TBPL) at Chennai recently for his contributions to the field of badminton for the past 45 years.
A six-time National Champion, Arun has won silver and bronze medals at the World Senior Badminton Championships held at Kaula Lumpur (Malaysia) and Sophia (Bulgaria) respectively.
A native of Nelji, close to Napoklu in Kodagu, Arun Poovaiah is presently based in Bengaluru and is involved in coaching budding Badminton players.
source: http://www.starofmysore.com / Star of Mysore / Home> Sports / May 13th, 2025
Karisma Aiyappa (centre) was crowned ‘Mrs. Bharat California 2025’ by Mydream TV USA at an event held at California recently.
Karisma, a HR/logistics professional in Silicon Valley, is a former State-level athlete and a passionate dancer.
Picture above shows Karisma walking the ramp in the traditional Kodava attire
A native of South Kodagu and daughter of Poilengada P. Machamma and late Alemanda Aiyappa, residents of Kuvempunagar in Mysuru, Karisma is married to Abhishek, an employee of Microsoft, Bay Area, California, USA.
Karisma’s participation in various Coorg events in the USA showcases her commitment to her heritage.
source: http://www.starofmysore.com / Star of Mysore / Home> Photo News / May 13th, 2025
Over 150 tribes from Jenukuruba, Betta Kuruba, Yarava and Paniya communities have occupied the forest land in Nagarhole Tiger Reserve, demanding implementation of the Forest Rights Act (FRA).
The tribals talking to forest officials in the Nagarahole Tiger ReservePhoto | Special Arrangement
Madikeri :
The 52 tribal families who entered the Nagarahole Tiger Reserve claiming land rights under the Forest Rights Act (FRA) continue to stay put inside the forest as a way of protest. Meanwhile, the forest department is urging them to vacate, citing legal and implementation hurdles.
Over 150 tribes from Jenukuruba, Betta Kuruba, Yarava and Paniya communities have occupied the forest land in Nagarhole Tiger Reserve, demanding implementation of the Forest Rights Act (FRA).
However, as per the forest department, the status quo has to be maintained until July 25, following the SC order. Further, the foresters are unable to force eviction as 50% of the population of the tribes who have occupied the land consists of women and children.
“We have not occupied the forest land, but we are occupying our ancestral land. We were evicted from the place under the Wildlife Protection Act nearly 45 years ago. After this, we stayed in line houses of the estates in the surrounding areas and we have been living in pitiable conditions since then. Following the FRA Act, we saw hope of reoccupying our ancestral land lawfully. It is a historical injustice that we were thrown out of the ancestral land and we have suffered enough,” shared Jenu Kurubara Shivu, one of the tribal leaders and secretary of Nagarahole Adivasi Tribe Forest Rights Implementation Committee.
He explained that they have been protesting for the implementation of the FRA from 2009-10. “After we learnt about FRA, a total of 52 tribal families put forth applications for the sanction of the forest right,” he explained.
He added that a joint verification process was ordered in 2021 and in 2024, a joint verification by the forest, revenue, tribal welfare and panchayat raj was conducted.
“While the report on the joint verification had to be submitted in four months, the same has been delayed invariably. The joint verification has not been signed by the concerned department officials, highlighting the inefficiency of the government departments,” he alleged.
He explained that numerous protests were led in the recent past and they had been shunned by the officials who he alleged extended false assurances.
“But this time, we have occupied our ancestral land and the indefinite protests will continue until we are granted our rights,” he voiced. The tribes have occupied the forest land for the past five days and have built make-shift structures for their deities inside the forest zone.
Meanwhile, the letter to the CM from retired PCCF BK Singh urged the government to temporarily stop the grant of land under the FRA. Further, Singh has also filed a petition with the SC and status quo of forests has been ordered till July 25, preventing any new activities or changes.
He has urged the state not to treat FRA as a land grant as this would escalate wildlife conflict and urged the government not to sanction land for those who occupied the forest after December 13, 2005.
Meanwhile, the forest department is of the opinion that the applications filed by the tribes for FRA were rejected in 2011. As per the government records, Attur Kolli Forest, the land that is now in conflict under FRA, falls under the Nagarahole Range and as per the previous data, there was no signs of habitat.
While the tribes had applied for rights under FRA in 2009, the same was rejected in 2011. Nevertheless, the SC ordered for a re-verification process of the applications in 2019 and a re-verification was carried out in 2024.
However, the report of the re-verification data has not been submitted by the Sub Divisional Level Committee and the District Level Committee till date, which is being opposed by the tribes.
“The tribes have occupied the forest land and we cannot force them out as there are women and children. Further, status quo has been ordered in natural forests following a petition by retired PCCF BK Singh. The status quo must be maintained till July 25 until further notice,” confirmed Ananya Kumar, Nagarahole Division ACF.
source: http://www.newindianexpress.com / The New Indian Express / Home> Karnataka / by Prajna GR / May 09th, 2025
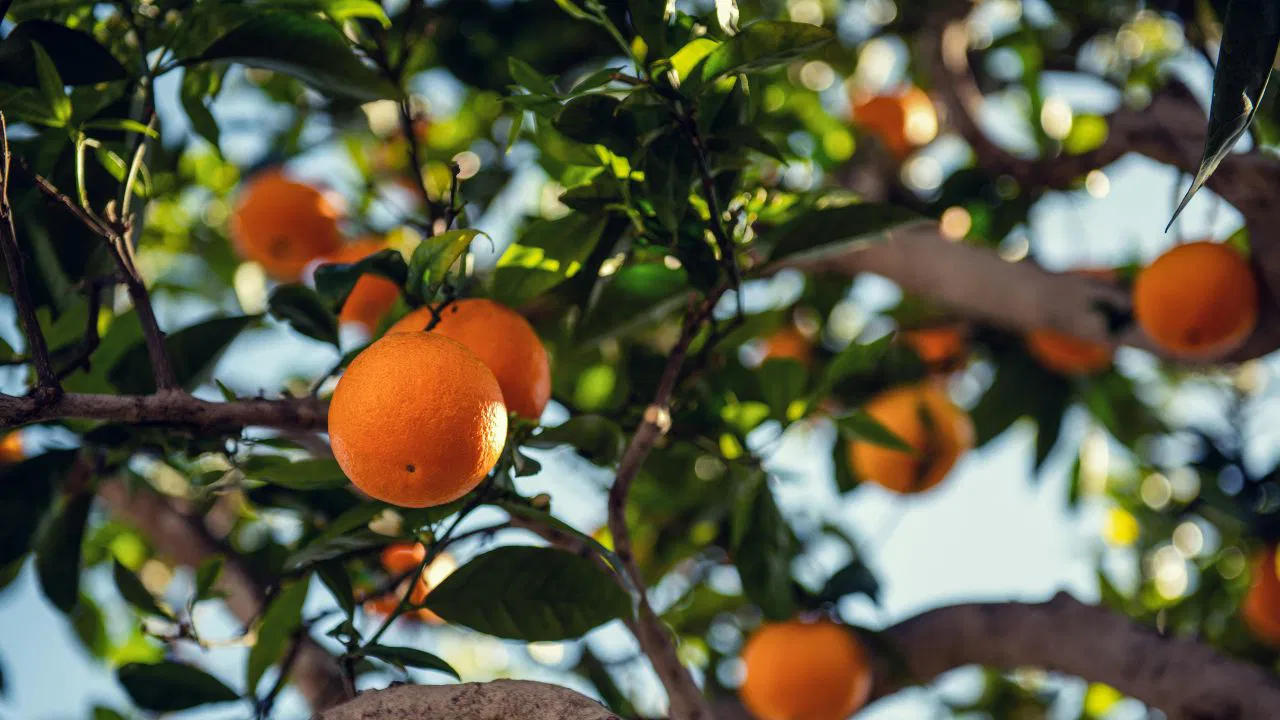
Coorg oranges, a unique citrus variety with a distinct sweet-sour taste, hold cultural, economic, and ecological significance. Despite challenges like declining production and pests, their Geographical Indication recognition offers hope for revival, making them a valuable crop for farmers in Coorg.
Coorg oranges are vulnerable to pest and disease infestations, such as citrus greening, fruit rot, and the damaging effects of citrus psyllids, which degrade fruit quality. (Image Credit- Pexels)
Coorg oranges, a distinctive variety of citrus fruit, are believed to be a man-made hybrid of mandarins (Citrus reticulata). With their greenish-yellow color, tight skin, and sweet-sour taste, these oranges are a significant part of the agricultural landscape in Coorg, Karnataka, India. Historically cultivated in the region, they have played a vital role in local culture, cuisine, and economic development. Although their production has declined over the years, efforts to preserve this unique citrus variety continue through Geographical Indication (GI) recognition and conservation initiatives.
Significance of Coorg Oranges
Coorg oranges hold deep cultural, economic, and ecological significance, symbolizing prosperity and tradition in the Kodava community. Historically cultivated for centuries, they play a vital role in local cuisine, festivals, and agricultural heritage. Economically, these oranges were once a major cash crop, sustaining local farmers and fueling agribusiness, while also contributing to Coorg’s eco-tourism appeal.
Known for their unique sweet-sour taste, Coorg oranges stand apart from conventional varieties with their resilient greenish-yellow skin and rich natural oils, which enhance their aromatic flavor and make them an integral part of the region’s biodiversity.
Coorg Oranges Cultivation
The cultivation of Coorg oranges requires a specific climate and soil conditions, making Coorg’s Western Ghats region an ideal environment for their growth. Their farming involves careful propagation, maintenance, and harvesting techniques.
Soil and Climate Requirements
Prefer well-drained loamy soil with adequate organic matter.
Thrive in the moderate temperatures and high humidity of Coorg.
Rainfall between 1,500 to 2,500 mm annually is ideal for their growth.
Propagation Methods
Primarily propagated through grafting, ensuring genetic consistency and quality.
Requires regular pruning to maintain productivity.
Proper spacing and irrigation enhance yield and fruit quality.
Harvesting Season
The oranges mature between November and January, marking the harvest period.
Farmers pick fruits when they are firm, full-sized, and greenish-yellow.
Post-harvest handling is crucial to maintain freshness and prevent spoilage.
Challenges
Coorg oranges, once historically significant, now face several challenges threatening their continued cultivation. The shift towards coffee plantations over the years has led to a decline in orange orchards, and poor maintenance practices have further reduced fruit yields.
Additionally, these oranges are vulnerable to pest and disease infestations, such as citrus greening, fruit rot, and the damaging effects of citrus psyllids, which degrade fruit quality. Climate change also plays a role, with erratic rainfall patterns disrupting the growth cycle and rising temperatures affecting flowering and fruit development.
On top of these environmental and agricultural issues, orange farmers also struggle with market and economic difficulties, including a lack of support, incentives, and increasing competition from other citrus varieties that impact demand.
Coorg oranges are not just a fruit—they are a symbol of Coorg’s rich agricultural heritage. Despite challenges such as declining production and pest issues, the GI recognition provides hope for revival. Their distinct flavor, nutritional benefits, and historical significance make them an essential part of Coorg’s identity. Conservation efforts and renewed interest in traditional farming practices may help ensure the survival of this remarkable citrus variety.
First published on: 03 May 2025, 17:28 IST
source: http://www.krishijagran.com / Krishi Jagran / Home> Agripedia / by Kirti Narwal / May 11th, 2025
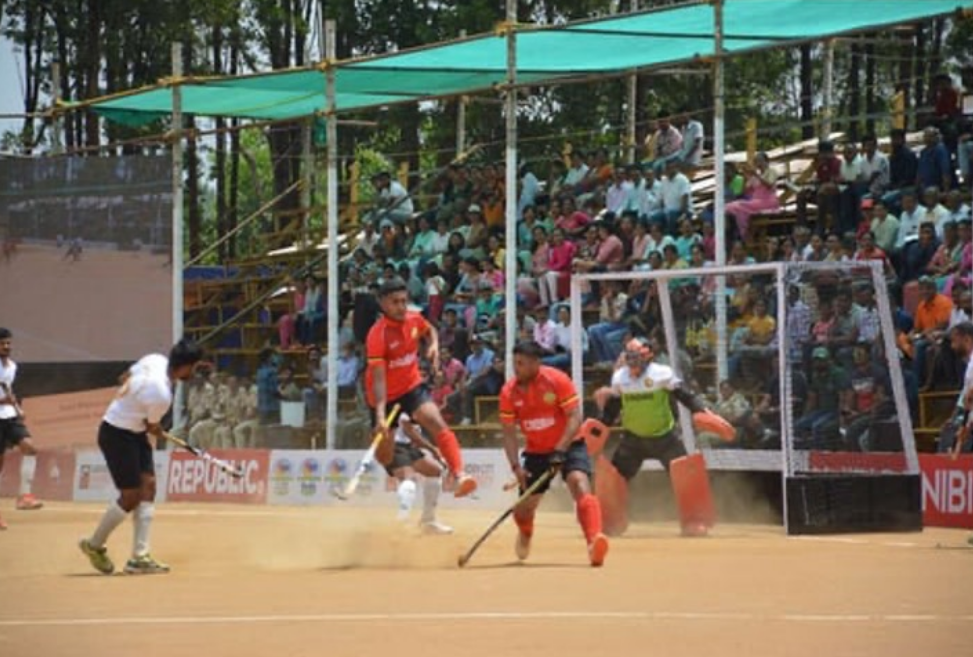
In the lush hills of Kodagu, a remarkable sporting and cultural phenomenon has reached a new milestone. The 25th edition of the Kodava Hockey Festival — hosted this year by the Kundyolanda family — has officially entered the Guinness World Records as the largest field hockey tournament, boasting an astonishing 3,640 players across over 360 family teams.
This year’s month-long edition ran across three grounds and finished late April.
What began as a dream in 1997 by the late Pandanda Kuttappa, a former hockey referee and State Bank of India employee, has transformed into an unparalleled spectacle of sport and community.
His vision was simple yet profound: unite the globally dispersed Kodava community through hockey — a sport embedded deep in their identity. Kodagu, often called the “cradle of Indian hockey,” has produced over 50 national players and seven Olympians, making the festival a natural extension of local pride.
“This festival is about more than just winning or losing,” Pandanda K. Bopanna, president of the Kodava Hockey Academy and son of the founder, told The Hindu newspaper.
“It’s about keeping our culture alive, connecting generations, and celebrating our heritage.”
This year’s silver jubilee celebrations were extra special. According to the official Guinness World Records entry, the event was recognised for having the most field hockey players in a tournament, overtaking all previous records.
“We have a rich tradition of serving the Armed forces. The British were already playing hockey and they found that the Kodavas had taken to the sport well. With a little bit of encouragement, the sport caught on,” says Navin Poonacha Kanganda, who has promoted the festival in the digital space, told Red Bull a few years ago.
A women’s tournament featuring 30 teams was introduced for the first time, symbolising the progressive spirit of the Kodava community. The festival torch — akin to the Olympic flame — was ceremoniously carried to the ancestral Ainmanes of past host families, reinforcing the powerful links between tradition and sport.
The Deccan Herald captured the festival’s atmosphere, describing the grounds as “a place where hockey sticks clash as fiercely as family pride, amid a carnival of Kodava culture.”
Traditional Kodava attire, food stalls, cultural performances, cyclothons, and shooting competitions lend the event the feel of a grand village fair — with hockey at its heart.
From humble beginnings in the small village of Karada with just 60 teams, the festival has grown into a massive undertaking requiring three specially-prepared mud fields, an effort largely borne by the host families.
“Despite international recognition, the festival struggles with basic sports infrastructure,” Bopanna noted. “The government must do more — a permanent hockey stadium in Kodagu would honour the festival’s contribution to Indian hockey.”
For the Kodavas, the festival is more than a sporting event.
As Ajjinikanda Mahesh Nachaiah, president of the Karnataka Kodava Sahitya Academy, put it: “It’s a reunion, a business hub, a marriage bureau, and a cultural festival all rolled into one.”
The clatter of sticks and laughter of reunited families echo a truth that Pandanda Kuttappa knew all along: hockey, for the Kodavas, is life itself.
source: http://www.thehockeypaper.co.uk / The Hockey Paper / Home> Features / by Hockey Paper Staff / May 06th, 2025
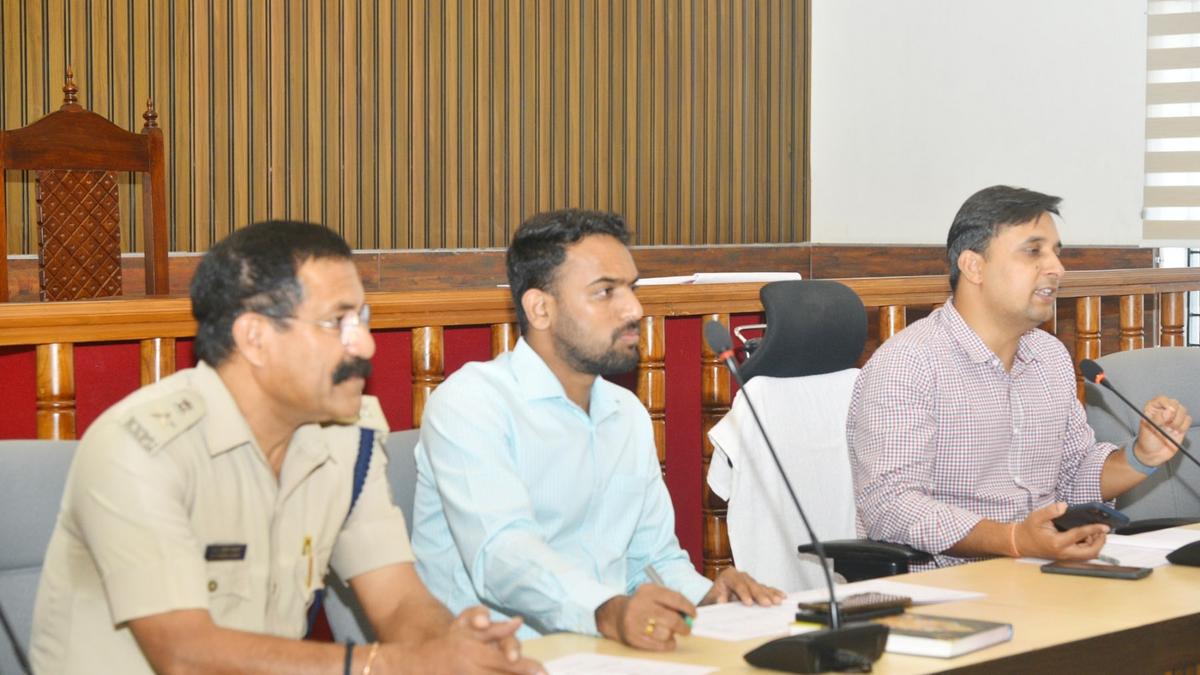
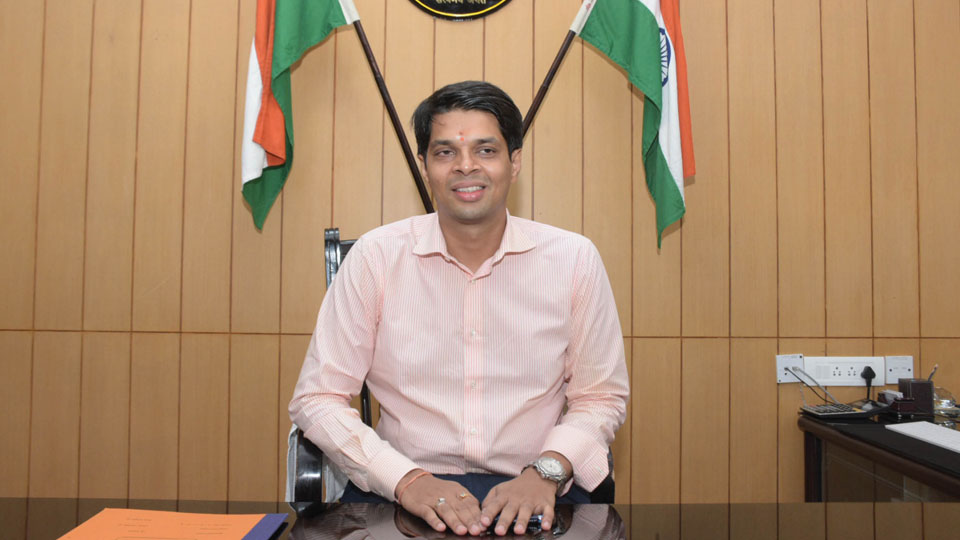
Deputy Commissioner Venkataraja presiding over the district disaster management authority meeting in Madikeri on Friday. | Photo Credit: SPECIAL ARRANGEMENT
Kodagu Deputy Commissioner Venkataraja on Friday directed nodal officers and engineers concerned to take necessary precautionary measures for monsoon preparedness.
He was speaking while presiding over the district disaster management authority meeting, held at his office in Madikeri.
The Deputy Commissioner said monsoon is likely to begin in June, and precautionary measures must be taken to prevent disasters caused by heavy rainfall.
Mr. Venkataraja stressed the importance of ensuring that there is no loss of human or animal life during the monsoon.
Nodal officers have already been appointed and must take necessary measures within their respective jurisdictions, with extra vigilance in sensitive areas, he told the meeting.
Fire and emergency services personnel must gear up to safeguard people in flood-prone areas and coordinate with the National Disaster Response Force teams during the season, he added.
Officials from the Department of Health and Family Welfare were told to stock necessary medicines and raise awareness to prevent the outbreak of communicable diseases. The Deputy Commissioner instructed engineers from the Public Works and Panchayat Raj Departments to repair roads in their jurisdiction.
Additional Deputy Commissioner R. Aishwarya, Additional Superintendent of Police Dinesh Kumar, and other district and taluk-level officials were present.
source: http://www.thehindu.com / The Hindu / Home> News> India> Karnataka / by The Hindu Bureau / May 09th, 2025
The Kodava Students Association (KSA), Mysuru, recently organised a hockey tournament at Chamundi Vihar Stadium, in Nazarbad, featuring 26 teams.
The two-day event showcased the commitment and unity of Kodava students pursuing higher education in Mysuru.
The tournament commenced on May 3 at 11 am in the presence of Ponjanda Ganapathy, President of Mysuru Kodava Samaja; Jammada Ayyanna, Treasurer of Jabhboomi Charitable Trust and Dr. Mathanda Aiyappa, Director of Brindavan Hospital.
KSA President Motteyanda Ishani Kuttappa presided.
During the ceremony, Jammada Ayyanna briefed the gathering on the ‘5-a-side hockey’ format, while Dr. Mathanda Aiyappa inspired the youths with motivating words, stressing the values of sportsmanship and perseverance. Ponjanda Ganapathy reaffirmed the continued support extended to Kodava students.
The opening day saw 18 matches, followed by quarter-finals, semi-finals and the grand finale on day-2, each match receiving enthusiastic cheers from the crowd.
Axilaratorz HC’ emerged as champions, while Bottiyath Naad, Kunda, finished as runners-up. ‘Blaze A’, Murnad, secured third place, with ‘Blaze B’, Murnad, taking fourth.
The closing ceremony featured a distinguished line-up of guests, including social activist Ajjikuttira Kanchan Ponnanna, wife of Virajpet MLA A.S. Ponnanna; Puliyanda Sujatha Bopanna, Dean at Sapient College; Baleyada Karun Kalappa, retired Senior Vice-President and Regional Head of a leading firm; Manjeera Kuttappa, a Progressive farmer from Kodagu and Chendanda Shammi Belliappa, Director of Druid Solutions Pvt. Ltd. and also KSA Advisor.
Kanchan Ponnanna delivered an inspiring address to the students, while Baleyada Karun Kalappa underscored the importance of balancing sports with academics. He urged the younger generation to consider careers in civil services, highlighting the Kodava community’s under-representation. Puliyanda Sujatha Bopanna also shared motivating insights.
Chendanda Shammi Belliappa commended the KSA team for their dedication and efforts to keep the sport of hockey alive in Mysuru. He thanked contributors such as R. Ashok (Mysore University Hockey Coach), Boliyadira Chetan Subbaiah, Muckatira Karthik Nanjappa, Mandepanda Kripan, and others for their support.
In recognition of outstanding achievements, Mandepanda Jasmine Kaveramma, CEO of Growthzone Company, UAE, and Monnanda Tasmai Kariappa, professional motorcycle racer, were felicitated.
Mookonda Sanjana proposed the vote of thanks, while Ajjetira Vikram provided engaging match commentary. The tournament was seamlessly coordinated by KSA’s Hon. Secretary, Mandetira Degul Ganapathy.
KSA Committee Members
The following students have been elected as KSA Committee Members: President – Motteyanda Ishani Kuttappa, Vice-President – Theetharamada Thanush Ganapathy, Hon. Secretary – Mandetira Degul Ganapathy, Joint Secretary – Mookonda Sanjana Damayanthi, Treasurer – Allaranda Kariappa, Joint Treasurer – Puchimanda Dipshika Daychamma, Cultural Heads: Kundyolanda Aiyappa (Amakka) and Kaliyanda Richa Poovamma (Pommakka).
source: http://www.starofmysore.com / Star of Mysore / Home> Sports / May 07th, 2025
3,400 school teachers deputed as enumerators in Mysuru district; survey to be held in three stages up to May 23
Mysuru:
Preparations have been all made for the survey of Scheduled Castes (SC) to provide internal reservation, across the State from tomorrow (May 5) till May 23. Following a report submitted to the State Government by Justice H.N. Nagamohan Das Commission, the survey is set to begin in Mysuru, Mandya, Chamarajanagar, Kodagu and Hassan districts, as part of the Statewide exercise, rekindling the hopes of the most backward sub-castes among the SC community to reap the benefits of inner reservation.
The very initiative stems from the judgement of seven-member bench of Supreme Court judges, on Aug. 1, 2024, favouring internal reservation, leaving it to the prerogative of respective State Governments to decide on the modalities to extend the reservation.
Following the apex court judgement, the State Government had formed Justice Nagamohan Das Commission, to carry out the survey in a scientific manner.
District Officer of Social Welfare Department Rangegowda, also the Nodal Officer of the survey, told Star of Mysore, in Mysuru district a total of 3,400 school teachers are roped in as enumerators for the survey. They will be deployed to conduct the survey at the polling booths in respective Gram Panchayat (GP) limits. They shall be going door-to-door and one supervisor has been deputed for every 10 enumerators. Besides, the Social Welfare Department Officer and Block Education Officers (BEO) shall be overseeing the survey.
A dedicated app has been developed to record the data in a scientific method online, with a questionnaire prepared for the purpose. The survey will cover both SC and non-SC households, during which the family members have to provide relevant information.
A Caste Survey Centre is being opened at every polling booth from May 18 to 20, where those who miss to be covered during the survey-either due to the enumerators skipping their house or the residents not present at home during the enumerators visit, may visit the centre to provide the required information.
Not sure of getting justice
Meanwhile, S. Arunkumar, advocate and President of Karnataka Samajika Nyayapara Vakeelara Vedike, sounded sceptical over SC communities getting any justice from the survey.
“Congress Government in the State is conducting the survey of SC community again, only for the sake of its vote bank politics, but there is no hope of getting justice. In the earlier surveys by Justice A.J. Sadashiva Commission, former Law Minister J.C. Madhuswamy headed Cabinet Sub-Committee and H. Kantharaju Commission that was constituted by the same Congress Government, Madigas have emerged as No.1 in population among SC communities. The State Government has in its possession, the data to corroborate the fact that the population of Madiga is higher. But still the Government is conducting a SC survey†said Advocate Arunkumar.
Share accurate info: DC
Deputy Commissioner G. Lakshmikanth Reddy appealed to the people to cooperate with the enumerators during the survey, by providing accurate details. The data will be collected in three stages.
In the first stage, from May 5 to 17, a door-to-door survey will be conducted and data will be uploaded on the app. In the second stage, from May 19 to 21, special camps will be set up and the data of those families excluded in the survey will be collected. In the third stage on May 22 and 23, SC families can voluntarily share details of their sub-castes online, added DC Reddy.
There are 101 sub-castes among Scheduled Caste (SC) and among them, the information related to Adi Karnataka and Adi Jambava and others will be collected during the survey. The photo of those who provide the information will be taken and uploaded on the app, to ensure authenticity in conducting the survey. The information of even those families which don’t belong to SC community should also be uploaded on the app, to ensure that no families are omitted during the survey. -DDPI Jaware Gowda
source: http://www.starofmysore.com / Star of Mysore / Home> News / May 04th, 2025
The fascinating genetic architecture of today’s Indian population is the result of thousands of years of population mixing and eventual isolation. The Coorgs are one such small and religiously/socioculturally homogeneous community in Karnataka, India, whose origins and demographic history are much debated due to their stark sociocultural contrast with surrounding populations. Here, we analyzed Coorgs using both autosomal (n = 70) and uniparental markers (n = 144). Our analyses suggest population substructure among Coorgs and showed significant population drift in Coorg3 in both allele frequency and haplotype-based analysis methods. Further sharing of haplotype and identity by descent suggests a shared genetic history of Coorg1 with the Palliyar population, and founder event analysis clearly indicates that the founder event in Coorg1 was around 40 GBP (Generations Before Present). The demographic models based on fastGlobeTrotter and Moments highlighted the recent admixture of Coorg3 with the northwest Indian Sikh Jatt population (~23 GBP); and also showed that Coorg2 was formed by mixing Coorg1 and Coorg3 at ~11 GBP, explaining their current sociocultural homogeneity. F-statistics-based admixture graph models suggest an as yet unknown lineage in Coorg3. mtDNA analysis revealed about 40% South Asia-specific mitochondrial lineages in Coorgs; while Y chromosome analysis revealed a predominance of Eurasian, Middle Eastern, and Indian-specific haplogroups, suggesting male-mediated migration and eventual assimilation with native females. These insights into ancient and diverse genealogies among Coorgs not only explain their unique status in the Indian diaspora but also encourage further research to identify unknown migrations to the Indian subcontinent and thus further unravel its unique demography.
Introduction
India is home for moderately isolated populations, which pose a stark contrast to their immediate and sub-continental neighbours due to genetic, geographical, cultural and linguistic factors. With only anecdotal accounts of their ancestry/origins, Indian population offer a unique opportunity to anthropologists and geneticists to understand their genetic history and unravel erstwhile unknown human migrations. The country continues to be popular for explorations of genetic architecture of ancient/isolated human populations with the most recent being the novel and exciting findings from the Rakhigarhi excavation sites1. The South Asian cline has emerged as a result of multiple waves of migration and genetic mixing among diverse populations over thousands of years. The Ancient Ancestral South Indians (AASI) are regarded as one of the earliest indigenous groups (65,000 ybp) inhabiting the Indian subcontinent and predominantly engaging in a hunter-gatherer lifestyle; and possess a distinct genetic lineage contributing to the genetic diversity observed in present-day South Asian populations. Notable amount of this ancestry was prevalent among people of Indus Valley Civilization (IVC) along with Iranian hunter gatherer ancestry1 but shows minimal relatedness to any specific modern-day population outside of the Indian subcontinent. Utilizing mitochondrial, Y-chromosomal and autosomal genomic markers, extant Indian populations have been suggested to be a blend of two hypothetical ancestral populations: the Ancestral North Indian (ANI) and the Ancestral South Indian (ASI)2,3. ANI was formed as a result of admixture of IVC people with Middle or Late Bronze Age Steppe (Steppe MLBA) people, while ASI was formed by admixture of IVC with AASI individuals. The contemporary Indian populations are the result of intermixing of these two ancestral populations between 1900 and 4200 years before present (ybp), with ANI and ASI contributing to varying proportions among caste and tribe groups of North and South India3. This suggests a complex history of genetic interactions and social dynamics in shaping the genetic landscape of the Indian subcontinent.
Karnataka, a state located in the southwestern part of India, is home to various ethnic groups with diverse ancestral lineages along with notable historical interactions with foreign traders and conquerors4. The Coorgs (also known as Kodavas) inhabiting Kodagu (Coorg) are one such group, nestled away in the Western Ghats, the geographically isolated, eroded slopes of the Deccan Plateau (Fig. 1A). The term Kodava is used for the language, culture and the dominant community inhabiting the region from pre-historic times. Traditionally a group of agriculturists with martial customs interlacing their day-to-day lives, the Coorgs practice family exogamy and caste endogamy till date4,5. Furthermore, the Coorgs are distinctly different from the neighbouring populations in their religious as well as socio-cultural practices. Though they presently follow Hinduism, various customs prevalent among the Coorgs notably deviate from the Hindu way of life6, resulting in two models for their origin.
_________________________________
Fig. 1: Sample collection location and population structure within Coorg.
A The geographical and sampling locations of contemporary Coorg samples. B Biplot of principal component analysis of Coorgs with modern Eurasian populations with first two components; C Stacked barplot of the ADMIXTURE analysis with K = 7 with global populations ordered geographically. (IndianIEU -Indian Indo-European, IndianDRAV—Indian Dravidian, IndianAAS—Indian Austroasiatic, IndianTB—Indian Tibeto-Burman).
The native model ascribes the Coorgs as pre-historic inhabitants of Kodagu. While Hutton described them as descendants of brachycephalic humans who entered the Indus Valley during the Mohenjodaro period7, the Kaveri Purana an inset of the ‘Skanda Purana’ (8th Century CE), classifies them as a warlike native tribe of Kodagu. Conversely, the non-native models ascribe their lineage to migratory groups such as i) The Indo-Greek army of Alexander’s India chapter; ii) pre-muslim Kurds or pre-Christian Georgians8; and iii) an off-shoot of the Indo-Scythian Sakas4,9. These being entirely anecdotal or from the early population dating, scientific evidence is lacking.
In this study, genetic architecture of the Coorg population, likely time of their origin and inter-population relatedness across contemporary and ancient global populations were investigated. We analysed a representative subset of socio-culturally homogenous present day Coorgs, using high-resolution mitochondrial DNA (mtDNA), Y-chromosomal and autosomal markers. This first report demarcates the population into three distinct early sub-groups (Coorg1, Coorg2 and Coorg3), which eventually admixed genetically and socio-culturally.
Results
Substructuring in Coorg population
The PCA biplots presented includes Coorgs (black), Indo-Europeans (blue), Dravidians (red), Austroasiatic speakers (brown), Tibeto-Burman (khaki), Pakistani groups (forest-green), and North West Indian (light-green). Interestingly, the Coorgs segregated into three groups and we named them as Coorg1, Coorg2 and Coorg3 (Fig. 1B). Coorg1 (black circles) clustered near extreme of the South Asian cline with most of the diverged Dravidian groups with highest ASI ancestry; Coorg2 (black diamonds) showed partial affinity with Indo-European and lay mid-way among Indo-European caste groups; Coorg3 (black triangles) was unique and did not cluster with any of the modern Eurasian or south Asian populations, who are seen as a single continuous cline of high West Eurasian to low West Eurasian affinity (Fig. 1B).
Unique ancestral component of Coorg3 in ADMIXTURE analysis
In the unsupervised model-based clustering with ADMIXTURE using K = 7 (Figs. 1C), Coorg3 which was isolated in PCA, formed a unique component (blue) different from other Eurasians. Coorg2 was similar in ancestry profile to Indo-Europeans, with similar proportions of red, teal and khaki components but with a minor Coorg3 component. Coorg1 individuals were enriched for the South Asian-specific (red) and with negligible Coorg3 components. Collectively, all the three Coorg groups share the Coorg3 component with each other.
Shared alleles among three Coorg groups and modern Eurasians
In the outgroup F3 statistics, three Coorg groups showed most allele sharing with each other followed by south Indian caste groups such as Gaud, Kunabi, Mala and Kallar caste groups (Supplementary Data 1a-c). Coorg1/GroupA shows highest outgroup F3 with Coorg2 (F3 = 0.04294; z = 135.58) followed by Coorg3 (F3 = 0.04288; z = 136.99) and Gaud (F3 = 0.04279; z = 129.72) from Telangana, India (Supplementary Data1a). Coorg2 shows highest allele sharing with Coorg1 (F3 = 0.04294; z = 135.58) followed by Coorg3 (F3 = 0.04284; z = 136.38) and Gaud (F3 = 0.04269; z = 129.72) (Supplementary Data 1b). Similarly, Coorg3 showed highest F3 value with Coorg1 (F3 = 0.04288; z = 136.99) followed by Coorg2 (F3 = 0.04284; z = 136.38) and Gaud (F3 = 0.04263; z = 132.59) (Supplementary Data 1c).
Genetic dissection of the three groups uncovers ancient ancestral lineages
In distal modelling, Andamanese Hunter-Gatherers (AHG), Iran Neolithic samples (Iran_N), Anatolia Neolithic samples (Anatolia_N) and Eastern European Hunter-Gatherers (EEHG) were used as left groups. Among all South Asian groups tested, Iran_N component was comparatively higher in Coorg3 (0.38) and Coorg2 (0.31) followed by Kamboj (0.27), Dogra (0.24) and Sikh_Jatt (0.21). Interestingly, composition of Coorg1, like Palliyar, was similar to AHG (0.7), Iran_N (0.2) and EEHG (0.04) (Fig. 2A; Supplementary Data 1g).
__________________________________
Fig. 2: Admixture modelling to infer ancient ancestral sources in Coorg.
A Distal and B Proximal admixture modelling with qpAdm for three Coorg groups and other Indo-European and Dravidian populations.
In proximal modelling with Bronze Age sources (AHG, Indus_Periphery and Steppe MLBA), Coorg3 had second highest contribution from Indus_Periphery (0.59) group after Kamboj (0.61), followed by Coorg2 (0.58), Dogra (0.57) and Sikh_Jatt (0.50) (Fig. 2B; Supplementary Data 1g).
Clues towards an ancestry from an additional admixture for Coorg3 using qpGraph
The three Coorg groups were jointly fitted into the Admixture graph topology using qpGraph implementation of Admixtools 210. Initial graph based on previous South Asian graph11 was used as a starting point with some simplification and automated graph exploration was run 30 times for each group using find_graph feature of Admixtools 2. Of the 10 best fits with score closer to zero and consistent with the known admixture history of South Asia, the top two best fitted topology are shown (Fig. S6A-B). Of note, both graph topologies required an additional source of ancestry from an unknown lineage for Coorg3 with 1% and 9% contribution for first and second graphs respectively; same held true with all the 10 best fitted graph topologies. Sample scores and bootstrap resampled scores for both fitted admixture graphs are shown in the Supplementary Data 1h.
Extreme population-specific drift and divergence in Coorg3 subgroup
In the Maximum likelihood tree constructed using TreeMix v.1.1212, although placed among Indian Indo-European caste groups, Coorg3 showed significant population-specific drift as indicated by longer branch length compared to other similar groups in South Asia except Kalash and Gujjar (Fig. S13). Though Coorg2 was placed in same clade with Coorg3, there was no significant drift. Coorg1 shared the same clade with Palliyar with exactly similar drift and both shared the clade with Ulladan, which had a much higher extent of drift (Fig. S13).
In distance matrix of WC-Fst, Coorg1 and Coorg3 showed similar drift to that of Austroasiatic group (Fig. S7). The extent of population-specific drift among Coorg2, Coorg3, Kalash and Gujjar was compared using qpGraph. Coorg3 had similar amount of drift as that of Kalash and Gujjar (Fig. S8B), while Coorg2 did not have any significant population-specific drift (Fig. S8A).
Fine scale population structure and haplotype sharing
PCA with the co-ancestry matrix from ChromoPainter13 clearly differentiated all three Coorg groups from other populations with distinct clustering at left corner, while others formed a cline along the diagonal at bottom-right (Fig. S9). Individuals of Coorg2 were in the same cluster with Coorg3, while Coorg1 individuals were placed away from Coorg2 and Coorg3 clusters (Fig. S9).
The fineSTRUCTURE13 tree kept all three Coorg group individuals in an isolated cluster of 2 minor clades, whereas other West Eurasian and South Asian groups were in three separate major clusters (Fig. S10). Coorg1 individuals were placed in one of the two minor clades along with Coorg2 (Fig. S10). However, none of the Coorg1/GroupA individuals were sharing clade with Coorg2 individuals. Coorg3 individuals were placed altogether separately from Coorg2 or Coorg1 individuals. In the simple coancestry matrix calculated from Chromopainter chunkcounts, Coorg1 was observed sharing chunks with Palliyar individuals (indicated by yellow ellipse in bottomright) (Fig. S11). All the three Coorg groups shared highest number of chunks with each other and also among themselves (top-right corner of the matrix) (Fig. S11).
Runs of homozygosity, relative IBD score and admixture dating
In the Runs of Homozygosity (RoH) analysis using Plink 1.914, Coorg1 showed highest mean of total length of RoH at the window size of 1000 kb, outcompeting even Palliyar (Fig. 3A) but mean total number of RoH was highest in Narikuruvar and Malaikuruvar. Conversely, Coorg3 had the least distribution in terms of both mean length and mean number of RoH among all the South Asian populations. Coorg2 was placed along with other Indo-European caste groups like Brahmin_Tiwari, Dogra and Lodhi indicating higher effective population size and low level of recent consanguinity. But for higher window sizes of 2500 kb (Fig. 3B) and 5000 kb (Fig. 3C), HakkiPikki outcompeted Coorg1. Yet, Coorg1 had highest distribution as compared to majority of castes and tribes in South Asia. We also tested the effect of Founder event/population bottleneck on RoH distribution using forward genetic simulation-based approach. We recreated three distinct demographic scenarios based on strength of founder events in Coorg1 and Coorg3 and also with no bottleneck scenario. Very similar distribution of RoH segments in both Coorg1 and Coorg3 was witnessed in comparison to empirical data (Fig S16).
________________________________
Fig. 3: Runs of homozygosity and identity by descent score in Coorg compared to modern references.
Scatter plot of the average lengths of Runs of Homozygosity (RoH) against average number of RoH segments for three Coorg groups and other South Asians using three different windows of (A) 1000 kb, (B) 2500 kb and (C) 5000 kb. D IBD score of three Coorg groups along with populations from India with significantly higher IBD score in relative to Finnish population.
IBD score of Coorg1 relative to Finnish population was very high (2.854) compared to Coorg2 (1.447) and Coorg3 (0.6), and was very close to Vysya (3.122), Reddy_Telangana (2.19) and Panta Kapu (2.175) (Fig. 3D) (Supplementary Data 1i). In the IBD chunk sharing matrix, Coorg2 and Coorg3 shared IBD only with each other and none of the modern Eurasian populations. On the other hand, Coorg1 shared IBD only with Palliyar and not with Coorg2 and Coorg3 (Fig S12).
In the estimation of the best fitted model and date of admixture using fastGlobeTrotter15, Coorg3 was fitted twice for admixture model with modern Eurasians. In the first model, we excluded Coorg2 and Coorg1 individuals as donor/surrogtaes for Coorg3, and the best sources for admixture were Pathan (ancestry proportion = 0.42) and Mala (ancestry proportion = ) dating approximately to ~98 generations before present (Supplementary Data 1d). Another model inferred after including Coorg1 and Coorg2 as donor/surrogates suggested admixture between Sikh_Jatt (ancestry proportion = 0.10) and Coorg2/GroupB (ancestry proportion = 0.90) (Supplementary Data 1d), suggesting a more recent admixture. Best fitted model of admixture for Coorg2 was between Coorg3 (ancestry proportion = 0.86) and Coorg1 (ancestry proportion = 0.16) (Supplementary Data 1e). The admixture model was one-date and more recently 11 generations ago (Supplementary Data 1e). The best fitted admixture model for Coorg1 was between Mala (ancestry proportion=0.40) and Palliyar (ancestry proportion = 0.60) at approximately 64 generations ago (Supplementary Data 1f).
Demographic history and demographic parameter estimation
We proposed two alternate demographic models for each of the Coorg groups based on known South Asian genetic admixture history using Demes16. For group specific demography, we used corresponding admixture model from fastGlobeTrotter15 runs. We used Moments’17 inference optimization function to arrive at best likelihood model and parameters. For Coorg1, we tested two alternate models, where Model1 hypothesize ASI (Ulladan and Palliyar-like) as direct ancestral source, while Model2 hypothesize putative admixture between group on ANI-ASI South Asian cline and ASI (Ulladan and Palliyar like). We selected Model2 (Log-likelihood: -165173.44976401704) over Model1 (Log-likelihood: -171341.95843789072) based on their likelihood scores, which corroborated well with admixture model inferred from fastGlobeTrotter15 run. Further, Coorg2 fits well in a relatively simple model of admixture between ANI and ASI (Log-likelihood: -150681.82191639318) compared to a more complex model of a putative source on Indian cline (ANI-ASI) and ASI (Ulladan and Palliyar) (Log-likelihood: -164313.6476346726). For Coorg3, we could obtain a best fitted model (Log-likelihood: -138845.99235543355) in which this group is derived from Indian cline (ANI-ASI admixture) with relatively recent pulse of admixture from ANI-like group. This recent admixture is also obtained in fastGlobeTrotter run (where Sikh_jatt is proxy for ANI and Coorg2 is proxy for Coorg3) (Supplementary Data 1d) (Fig. 4A-C).
________________________________
Fig. 4: Demographic modelling in three Coorg groups and inferred parameters.
A Best fitted Demographic model for Coorg1/GroupA inferred from Moments and corresponding fitted parameters. B Best fitted Demographic model for Coorg2/GroupB inferred from Moments and corresponding fitted parameters. C Best fitted Demographic model for Coorg3/GroupC inferred from Moments and corresponding fitted parameters.
Model parameter estimates from best fitted model of Coorg1 suggest significant reduction in effective population size in this group, with much less migration rates between ANI and Coorg1 (M_French_GroupA = 7.35e-05) (Fig. 4A). This effective population size change was lesser in case of Coorg3 and least in case of Coorg2 (Fig. 4B-C). Migration rate between ANI/French and Coorg2 was higher as compared to Coorg3, which reflects that Coorg3 remained comparatively isolated.
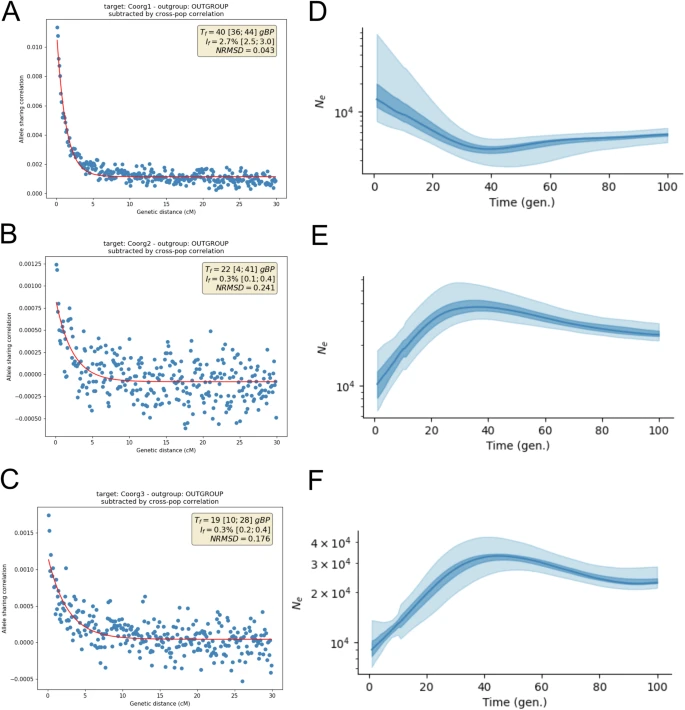
Historical effective population separation history and Y STR-based network analysis
We first tested the presence of any founder event in the three Coorg groups using ASCEND, but we observed significant founder event only in Coorg1 (If = 2.7%; Tf=40 GBP) (Fig. 5A). In Linkage-Disequilibrium (LD)-based historical population size history using HapNe-LD18, we observed a very slight reduction in size in Coorg1 at generation 40, then continuous increase in size thereafter (Fig. 5D). This correlates with ASCEND19 based founder event estimate at 40 generation ago (Fig. 5A). On the other hand, both Coorg2 and Coorg3 show continuous decline in effective population size just after 40 GBP (Fig. 5E-F).
______________________________________
Fig. 5: Strength and probable timing of founder event in Coorg groups.
ASCEND plots showing time (Tf) and strength (If) of founder events (if any) happening in the population history of: (A) Coorg1 (B) Coorg2 and (C) Coorg3. HapneLD-based historical effective population size history for Coorg1 group (D) Coorg2 group (E) and Coorg3 group (F) X-axis represents times in generations before and Y-axis represents effective population size.
There was a major migration and population turnover in India during the Bronze age related to Steppe groups carrying R1a lineage; and R1a-M780 and R1a-Z2125 were two distinct lineages present among Bronze age cultures of Steppe11. Therefore, we explored the relative contribution and diversity of these two Y chromosomal R1a lineages among Coorgs (as our Globetrotter admixture model suggests Coorg3 lineage dating back to Bronze age). Median-Joining (MJ) network for two sister clades R1a-M780 and R1a-Z2125 was constructed using a dataset of 17 Y chromosome STRs of the three Coorg groups (Supplementary Data 2e). Samples not used for genome-wide SNP array (for whom affiliation to Coorg1, Coorg2 and Coorg3 is unknown) were also included. In the analysis with both markers (M780 and Z2125), distinct clustering of Coorg individuals in a separate branch and not with any of the Central Asian, Middle East or South Asian branches was observed (with exception of a single individual with Central Asians in case of M780) (Fig. S17). The Time to Most Recent Common Ancestor (TMRCA) analysis for R1a-M780 and R1a-Z2125 suggest more distant divergence time for Coorg haplotypes compared to any other Indian R1a haplotypes. Among the three Coorg groups, Coorg3 R1a lineages are most ancient followed by Coorg1 and then Coorg2 (which is comparatively more recent) (Supplementary Data 2f).
GRAPH 06
Mitochondrial markers enriched for South Asian haplogroups across the three Coorg groups
Coorg2 and Coorg3 were more diverse compared to Coorg1 in terms of mitochondrial haplogroup diversity, with presence of four major haplogroups (M, U, R and H or HV) (Supplementary Data 2a-c). All the three Coorg subgroups had highest frequency of South Asian-specific major haplogroup M, followed by H. Haplogroup U was observed only in Coorg2 (0.25) and Coorg3 (0.16) subgroups, while mitochondrial haplogroup R was present with highest frequency in Coorg1. Apart from these, unique haplogroups such as haplogroup G in Coorg2 (0.04), haplogroup HV in Coorg3 (0.07) and haplogroup T in Coorg1 (0.08) were also observed in low frequency (Supplementary Data 2a-c).
In terms of Y chromosome haplogroup distribution, Middle Eastern haplogroup J and Indus civilisation-related haplogroup L were present at comparable frequency in all three Coorg groups (Supplementary Data 2a-c). However, South Asian-specific Y chromosome haplogroup H was observed with highest frequency in Coorg 3 (0.45), lesser in Coorg 2 (0.14) and with a complete absence in Coorg 1 (see discussion). Steppe related haplogroup R1 was highly prevalent in Coorg1 (0.5), followed by Coorg2 (0.32) and Coorg3 (0.07). South Asian-specific haplogroup R2 was observed in all three groups with moderate frequency. A few unique haplogroups such as haplogroups O in Coorg2 (0.04) and Coorg3 (0.03) and haplogroup K in Coorg2 (0.04) were also observed.
Discussion
The population history of India is rich, varied, interesting as well as intriguing. The extensive diversity in this rather old subcontinent is due to multiple waves of migration into the region from foreign lands, over millennia and eventual geographical and linguistic isolation and practicing of endogamy. This in-depth study on one such small, isolated and socio-culturally homogenous unique sub-population of Coorgs revealed their ancient origin, immense population drift due to isolation and a notable contrast with the neighbouring populations.
Multifaceted analyses revealed: i) a clear delineation of the present-day Coorg population into three distinct groups: Coorg1, Coorg2 and Coorg3 (Fig. 1B); and ii) their distinctness from neighbouring populations (Fig. 1B) warrants further investigation. Diverse ethnolinguistic groups such as the Kannadigas, Konkanis, and Tuluvas populating Karnataka are a mixture of ANI and ASI ancestry but Coorg1 and Coorg2 though falling on this cline, remain distinct entities. Furthermore, other martial ethno-linguistic groups similar to the Coorgs including Nairs, Bunts, Ezhava, and Hoysala Brahmins have shown an early separation from the Indo-Gangetic Indo-Europeans and the Dravidians and with enhanced middle-eastern component20, Coorg2 being the most similar to them (Fig. 1B). Coorg1 with the highest similarity to tribal populations such as the Palliyar, is also distinct from local tribes such as the Kurchas, Kurubas, Kurumans, Ezhavas (Fig. 1B). This distinction can be attributed to a significant population size change in this group (Fig. 5D-F) which correlates with the occurrence of a founder event ~40 GBP (Fig. 5A-C). Conversely, Coorg3 stands out as a starkly distinct group (Fig. 1B). The original individualities of these three groups are further cemented by the differing divergence times observed in Coorg1, Coorg2, and Coorg3 (~64 GBP, ~11 GBP, ~98 GBP, respectively; Supplementary Data 1d-f). Coorg2 arose from admixture events between comparatively older Coorg1 and Coorg3 (Supplementary Data 1e). The subsequent practice of family exogamy and caste endogamy among contemporary Coorgs (and throughout the Indian subcontinent)3 might be responsible for the substructure retained in the study cohort. However, all these groups eventually admixed genetically (Supplementary Data 1a-c, Figs. S10–12) which is in line with the socio-cultural history of the contemporary Coorgs (see Introduction). These admixture events are corroborated by chromopainter co-ancestry matrix and IBD sharing where Coorg2 showed some affinity to Coorg3 (Figs. S11–S12).
Recent consanguinity or high-level inbreeding as the cause of divergence patterns observed among Coorg1 and Coorg 3 was ruled out by RoH analysis (Fig. 3A-C). Higher RoH measures seen in Coorg1 comparable to those of old and divergent populations like Palliyar and Kallar and higher relative IBD scores of Coorg1 suggest founder event and endogamy and suggest its antiquity, compared to Coorg2 and Coorg3 (Fig. 3D) (Supplementary Data 1f). Analyses of uni-parental markers lend to this observation as well, wherein higher mtDNA diversity observed among Coorg2 and Coorg3 reflects the past expanding nature of these populations, whereas Coorg1, with its homogenous haplogroup distribution indicates a population bottleneck. High frequency of Y-chromosome haplogroup R1 in Coorg1 (Supplementary Data 2a-c) may also be a consequence of an identical founder event, suggesting that this group likely suffered similar drift like Palliyar due to long-term isolation (discussed below).
Genetic architecture of Coorg2 and Coorg3 in the light of their neighbouring, globally contemporary, and ancient populations draws attention. The mtDNA diversity of the three Coorg groups largely reflects their South Asian-specific maternal lineage along with some West Eurasian admixture (as evident by the presence of mtDNA haplogroups HV, H, U). However, Coorg2 showed moderate affinity to the sub-populations with ANI ancestry such as Nair, Bunt, Thiyya and Hoysala (Fig. 1B) reported to have comparably higher Middle Eastern components20; comparatively higher frequency of haplogroup R1 in Coorg2 (Supplementary Data 2a-c) suggesting their local Indo-European affinities, also reflected in the allele frequency-based analysis (Fig. S8). The presence of South Asian-specific haplogroup H in Coorg3 (frequency 0.45) is surprising considering their Indo-European genetic composition (Fig. 1C). A much earlier migration and settlement of Coorg3 (supported by earliest coalescent time of the R1a-M780 and R1a-Z2125 haplotypes) in South Asia compared to all other Indo-European migrations; and assimilation of local group(s) followed by typical South Asian ANI-ASI admixture event much earlier is plausible. After this major admixture event, Coorg3 witnessed long-term isolation followed by only very recent (~16 GBP), but minimal admixture with a northwest Indian group (Sikh_Jatt as a surrogate)—a representative of ANI-like population, corroborated both via admixture and demographic modelling. (Supplementary Data 1f). Northwest Indian groups had shown additional Middle-Eastern component along with Southwest Indian warrior clans (Nairs, Bunt and Thiyya)20. This second admixture event seems to be putative source for enhanced Middle-Eastern component in Coorg3 and later in Coorg2. Coorgs historically being a martial race lend further support to these events. Furthermore, all the qpAdm rotation models for Coorg3 best fitted only with additional source of Middle Eastern ancestry (Supplementary Data 1j). More ancient lineage and earlier separation history of Coorgs is further supported by M780 and Z2125 marker Y-STR networks and also earliest coalescent times for M780 and Z2125 haplotypes for Coorg3 (Fig S17) (Supplementary Data 2f), which were of independent Y chromosome lineage. They were not sharing Y chromosome haplotypes with any of the South Asian groups under M780 or Z2125 affiliations. These may have arrived in India much earlier and with no admixture event with any R1a lineage of India thereafter (Fig. S17).
At this juncture, despite inhabiting distinct and isolated regions of South India, it may be relevant to discuss the shared genetic ancestry of Coorg1 with Palliyar, a population group with negligible Steppe contribution11, evident in their sharing of clade in TreeMix analysis with similar amount of drift (Fig. S13) and also in fineSTRUCTURE tree (Fig. S10). Admixture modelling further indicates that admixture between Palliyar and Mala has given rise to C1 ~ 64 GBP (Supplementary Data 1d).
Population genomic studies with such a strong and unique population-specific drift as witnessed in Coorg3 have not been reported till date in the Indian context, except for the Kalash of Pakistan being reported as a genetic isolate21. Another such group is Gujjar, a small tribe from Kashmir, India, which clusters in PCA and admixture analysis with main Indian cline along with northwest India and Pakistan groups and has higher IBD scores22 and also reflected in our study. They also have higher RoH distribution exhibiting high level of endogamy and likely explaining their higher drift length in TreeMix. However, Coorg3 shows a notable genetic drift in PCA (Fig. 1B) and Admixture (Fig. 1C) but not in IBD (Fig. 5D) and RoH distribution (Fig. 5A-C). Additionally, there is no clue of any significant founder event or population bottleneck in this group (Fig. 3A-F), indicating that only possible cause of drift may be long-term isolation. This phenomenon is further validated by the very low migration rate parameter in this group as revealed by demographic modelling (Fig. 4). A population demonstrating such a drift may serve as a good resource to study evolutionary aspects in natural populations. Furthermore, Coorg1 captured here to be a sister clade of Palliyar, which is proposed as a proxy for ASI11 may also be useful.
Finally, this study presents the insightful evidence for an ancient origin and unique genetic architecture of the Coorg population. However, a recent study could not corroborate their oral history with the genetic architecture along with many other groups from South West India23. The three distinct genetically heterogeneous clusters date back to late Bronze Age. However, it is evident that a) this group had a much higher contribution of ancient Bronze-Age Middle Eastern ancestry; b) they had diverged and separated much before which stands in stark contrast to their Indian subcontinental neighbours; and c) an additional wave of admixture more recently from a source group related to contemporary northwest Indian groups. Coorg1 is an old population and an integral part of the present-day Coorgs. Considerable genetic drift observed in Coorg3 was not found among any Indian population on ANI-ASI cline till date, except Onge, who had history of long-time isolation and migration prior to major ANI-ASI admixture event. Furthermore, the negligible load of autosomal recessive disorders in this small (<0.3 million) population practising family exogamy but caste endogamy, even in the light of high IBD scores of Coorg1 similar to Finnish or Ashkenazi Jews, lends further support to a contribution of diverse gene pools from the three Coorg groups through an eventual admixture among themselves.
Taken together, the results of this study corroborate a model wherein Coorg1 (native) and Coorg3 (neighbouring, with recent local contribution from ANI-like Sikh Jatt population) are all late Bronze Age and were initially isolated spatio-temporally but eventually converged geographically and admixed genetically to give rise to Coorg2. This model, upheld by the extensive tools utilised in the study, explain the contemporary socio-cultural homogeneity of the current day Coorgs. Further, in case of Coorgs, cultural assimilation occurred much later than their genetic delineation into distinct groups.
Methods
Study subjects
Coorgs are a very small population group comprising <0.3 million individuals, belonging to approximately 1200 extended families (each identified with a unique family name) residing throughout Kodagu (Fig. 1A). As contemporary Coorgs (individuals recruited for this study) practice family exogamy and caste endogamy, only one member each from approximately 12% (n = 144) of the total families from across Kodagu were recruited. Furthermore, considering an overall historical prevalence of male-centric migrations and to capture both maternal and paternal lineages, only males (25–70 years of age) were recruited with informed written consent. Institutional ethical committee clearance was obtained prior to sample collection. DNA was isolated from ~5.0 ml of venous blood from each participant.
A geographical map showing the sampling location (Fig. 1A) in the Kodagu district in Karnataka, India was produced in R24 using the package ggplot225 and sf26.
Genotyping of samples and statistical analysis
Autosomal markers
A subset of the samples (n = 70) was genotyped using Affymetrix Axiom GW Human Origin Array for 633,994 SNPs as per the manufacturer’s specifications through a commercial facility (Imperial Life Sciences, Gurugram, Haryana).
Quality Control: The dataset was merged with published DNA dataset of contemporary Indian populations (Supplementary Table 1) after filtering for missingness using Plink 1.914, and only autosomal markers on 22 chromosomes having genotyping call rate >99% and minor allele frequency >1% were included. Dataset was further pruned by removing individuals with first-degree and second-degree relatedness utilizing KING-robust27 feature implemented in Plink214. After all filtering, final merged dataset comprised of 968 modern individuals genotyped at 405,962 SNPs.
In order to minimize the effect of background LD in PCA28 and ADMIXTURE29 like analysis, the markers were further thinned by removing SNPs in strong LD (r2 > 0.4, window of 200 SNPs, sliding window of 25 SNPs at a time) using Plink 1.914. For all the analysis with ancient DNA, Coorg samples were merged with west Eurasian autosomal DNA published datasets of 765 individuals with relevance to the incumbent sample set11,30,31,32,33,34,35,36,37,38,39. In this merged dataset, missingness criteria of geno >0.7 was applied to include only those individuals covered at at least 70% of sites resulting into 968 individuals covered at 442230 sites.
mtDNA markers
Mitochondrial DNA of all samples was PCR amplified using a set of 24 sets of primer40 followed by Sanger sequencing.
Y-chromosome markers
Genotyping of all samples for a total of 18 Y-chromosome binary markers to determine haplogroups was performed. PCR-amplified amplicons were sequenced using ABI 3730 automated Genetic Analyzer. Y-STR typing for 17 markers was done using ampFLSTRTM YfilerTM PCR amplification kit.
Statistics and reproducibility
Principal component analysis
Principal Component analysis (PCA) was performed on the merged dataset of modern Eurasian using the smartpca package implemented in EIGENSOFT 7.2.128 with default settings. The first two components were plotted to infer genetic variability.
ADMIXTURE analysis
Model-based clustering algorithm ADMIXTURE29 was run to infer ancestral genomic components in Coorg population inferred from the PCA performed. Cross validation was run 25 times for 12 ancestral clusters (K = 3 to K = 14) (Fig S1). Lowest CV error parameter was obtained at K = 7 and was used for downstream analysis.
Maximum likelihood tree construction
A maximum likelihood (ML) tree was constructed for the merged dataset comprising of modern South Asian populations and the Coorgs with TreeMix v.1.1212 using LD blocks of 500 SNPs grouped together and Onge as an outgroup.
Runs of homozygosity
Runs of Homozygosity (RoH) analysis was performed using PLINK v1.914 with three homozygous windows of 1000 kb, 2500 kb and 5000 kb with minimum 50 consecutive SNPs.
IBD score calculation and IBD sharing
IBD scores for the three Coorg groups relative to Finnish population was calculated with same pipeline as used in our earlier study22. SHAPEIT version 4.2.241 for phasing the genotype data and Refined-IBD tool42 for IBD detection were used. Then slightly modified R script from Nathan et al. 2017 was used for IBD score calculation. IBD sharing matrix was plotted using custom script in R. Historical effective population size history was determined using HapNe-LD method using genotype data.
F3-statistics
qp3Pop implementation of ADMIXTOOLS43 package was utilised to calculate outgroup F3 statistics. To infer gene flow from modern Eurasians in three groups of Coorg populations F3 statistics were used in the form of F3 (Yoruba; GroupA/GroupB/GroupC, X), where X is any modern west Eurasian or south Asian population. (GroupA=Coorg1; GroupB=Coorg2 and GroupC=Coorg3).
CHROMOPAINTER and FineStructure
Haplotype-based approach implemented in CHROMOPAINTER13 and FineStructure13 was used to derive co-ancestry matrix and fine scale population clustering, respectively. Data was first phased with SHAPEIT544 using default parameters, followed by CHROMOPAINTER run to infer co-ancestry matrix, first by performing 10 Expectation-Maximization (EM) iteration with 5 randomly selected chromosomes with a subset of individuals to infer global mutation rate (µ) and switch rate parameters (Ne). Then the main algorithm was run with 22 chromosomes with all the individuals to derive the co-ancestry matrix. This matrix was used by FineStructure to derive clustering using a probability model by applying Markov chain Monte Carlo (MCMC) procedure and then inferring hierarchical tree by merging all clusters with least change in posterior probability. For the run 500,000 burn-in iterations and 1,000,000 subsequent iterations were used, and the results stored from every 10,000th iteration. Admixture dates estimates and best admixture models were inferred using fastGlobeTrotter15 using Chromopainter chunklength files.
Proximal and distal modelling with ancient DNA
qpAdm in the ADMIXTOOLS 210 package in R was used to estimate proportions of ancient ancestral components in a test population (Coorg1/Coorg2/Coorg3) derived from a set of N source population groups having shared drift with a set of reference populations. Distal and Proximal modelling of admixture was performed using pre-Bronze Age aDNA source groups and Bronze Age proximal sources, respectively (Supplementary Table 2). In distal modelling AHG, Iran_N, Anatolia_N and EEHG were used as source groups, while Ethiopia_4500BP_published.SG, ANE, Shamanka_EN, PPNB, Dai.DG, Natufian, WSHG and WEHG as references. In proximal modelling AHG, Indus_Periphery and Steppe_MLBA were used as source groups and Ethiopia_4500BP_published.SG, Ganj_Dareh_N, EEHG, PPNB, Dai.DG, Anatolia_N, WEHG and Shamanka_EN were taken as references. Fitted admixture graph topology were obtained with qpGraph function of ADMIXTOOLS 210 using automated graph exploration with find_graph for three Coorg groups using modern and ancient Eurasians as reference. qpGraph was further used to model Coorg2 and Coorg3 along with Kalash and Gujjar as a mixture of ANI and ASI ancestry, using the model (YRI, (Coorg2/Coorg3/Kalash/Gujjar, (Georgians, ANI)), [(ASI, Onge])) proposed by Moorjani et al (17). This method was used earlier in Nakatsuka et al. (2017)22 to estimate the strength of founder effect in Indian populations by measuring post-admixture drift.
Demographic history of three Coorg groups using Demes and moments
To infer best fitted demographic model and model parameters we used parameter optimization method implemented in Moments17. For each of three groups (Coorg1, Coorg2 and Coorg3), we used preliminary model based on known south Asian genetic history and fastGlobeTrotter15 admixture models of Coorg groups. For model construction, we used Demes16 Python package. Parameter files were prepared based on respective Demes models. Two alternative models were used for comparison of demographic scenario of each of three Coorg groups. Site Frequency Spectrum were calculated from empirical data in VCF format as well as from Demes model specifications using Moments. Model parameter optimizations were performed using 300 iterations and using “lbfgsb” method. Confidence intervals for inferred parameters were calculated using moments.Demes.Inference.uncerts function of Moments.
Forward genetic simulation to test the effect of bottleneck history on the RoH distribution
Slim v3 was used to simulate three distinct population history models. Using forward genetic simulation we tested the effects of (A) no Bottleneck, (B) Coorg1 group-specific population bottleneck and (C) Coorg3 group-specific population bottleneck on the genome-wide RoH distribution. The time and strength of Coorg1 and Coorg3 models were replicated from the results of ASCEND based and IBDNe based methods.
mtDNA
Sequences were assembled with the reference sequence rCRS45 using AutoAssembler. Variations observed were used to assign the haplogroup using phylotree build 1746 and Haplogrep247.
Y-chromosome
Sequences were compared with reference to mark the variations and assign the haplogroups. In order to estimate population divergence, Weir-Cockerham’s Fst was measured using R package SambaR48 utilising the same pruned dataset as used in PCA and Admixture. Basic Quality Checks of data were done in the same R package. For the Y STR data analysis and TMRCA, the Y-LineageTracker49 tool was used.
Ethical approval
Informed written consent was taken from each participant. The project was carried out in agreement with the guidelines approved by the Institutional Ethical Committees of Centre for Cellular and Molecular Biology, Hyderabad, India. All experimental protocols were also approved by the Committee of the Centre for Cellular and Molecular Biology-CSIR, Hyderabad, India. All ethical regulations relevant to human research participants were followed and all the experimental methods comply with the Helsinki Declaration.
The data supporting the findings of this study are available in the Zenodo repository https://doi.org/10.5281/zenodo.13913146 and can be accessed upon request. The quality-filtered genome-wide SNP data is available with Zenodo link https://doi.org/10.5281/zenodo.13913147 and the fasta files for complete mitogenomes from Coorg are available with NCBI GenBank accession ids: PV166801-PV166900.
References
Shinde, V. et al. An ancient Harappan genome lacks ancestry from steppe pastoralists or Iranian farmers. Cell179, 729–735.e710 (2019).ArticleCASPubMedPubMed CentralGoogle Scholar
Reich, D., Thangaraj, K., Patterson, N., Price, A. L. & Singh, L. Reconstructing Indian population history. Nature461, 489–494 (2009).ArticleCASPubMedPubMed CentralGoogle Scholar
Kamath, S. U. Karnataka State Gazetteer: Gazetteer of India. Kodagu district : (Coorg)/chief ed.: Suryanath U. Kamath. Koga,1993. (Government Press, 1993).
Cariappa, M. P. & Cariappa, P. The Coorgs and Their Origins. (Geetha Book House, 1981).
Bopanna, P. T. Are Kodavas (Coorgs) Hindus? (Rolling Stone Publications, 2022).
Balakrishnan, R. Phonology of Kodagu with Vocabulary. (Annamalai University, 1976).
Bowring, L. B. Eastern Experiences. (H.S. King, 1872).
Rajyashree, K. J. L. I. I. Kodava speech community: an ethnolinguistic study. 1, 1-10 (2001).
Maier, R. et al. On the limits of fitting complex models of population history to f-statistics. Elife12, e85492 (2023).
Pickrell, J. K. & Pritchard, J. K. Inference of population splits and mixtures from genome-wide allele frequency data. PLoS Genet.8, e1002967 (2012).ArticleCASPubMedPubMed CentralGoogle Scholar
Lawson, D. J., Hellenthal, G., Myers, S. & Falush, D. Inference of population structure using dense haplotype data. PLoS Genet.8, e1002453 (2012).ArticleCASPubMedPubMed CentralGoogle Scholar
Chang, C. C. et al. Second-generation PLINK: rising to the challenge of larger and richer datasets. Gigascience4, 7 (2015).ArticlePubMedPubMed CentralGoogle Scholar
Wangkumhang, P., Greenfield, M. & Hellenthal, G. An efficient method to identify, date, and describe admixture events using haplotype information. Genome Res.32, 1553–1564 (2022).ArticleCASPubMedPubMed CentralGoogle Scholar
Jouganous, J., Long, W., Ragsdale, A. P. & Gravel, S. Inferring the joint demographic history of multiple populations: beyond the diffusion approximation. Genetics206, 1549–1567 (2017).ArticlePubMedPubMed CentralGoogle Scholar
Fournier, R., Tsangalidou, Z., Reich, D. & Palamara, P. F. Haplotype-based inference of recent effective population size in modern and ancient DNA samples. Nat. Commun.14, 7945 (2023).ArticleCASPubMedPubMed CentralGoogle Scholar
Tournebize, R., Chu, G. & Moorjani, P. Reconstructing the history of founder events using genome-wide patterns of allele sharing across individuals. PLoS Genet18, e1010243 (2022).
Kumar, L. et al. Genetic affinities and adaptation of the south-west coast populations of India. Genome Biol. Evol.15, evad225 (2023).ArticlePubMedPubMed CentralGoogle Scholar
Nakatsuka, N. et al. The promise of discovering population-specific disease-associated genes in South Asia. Nat. Genet.49, 1403–1407 (2017).ArticleCASPubMedPubMed CentralGoogle Scholar
Biddanda, A. et al. Distinct positions of genetic and oral histories: Perspectives from India. HGG Adv.5, 100305 (2024).CASPubMedPubMed CentralGoogle Scholar
Team, R. C. in R Foundation for Statistical Computing, Vienna, Austria (2021).
Wickham, H. ggplot2: Elegant Graphics for Data Analysis. (Springer International Publishing, 2016).
Bivand, R. S., Pebesma, E. & Gómez-Rubio, V. Applied Spatial Data Analysis with R. (Springer New York, 2013).
Alexander, D. H., Novembre, J. & Lange, K. Fast model-based estimation of ancestry in unrelated individuals. Genome Res.19, 1655–1664 (2009).ArticleCASPubMedPubMed CentralGoogle Scholar
Allentoft, M. E. et al. Population genomics of Bronze Age Eurasia. Nature522, 167–172 (2015).ArticleCASPubMedGoogle Scholar
Damgaard, P. B. et al. 137 ancient human genomes from across the Eurasian steppes. Nature557, 369–374 (2018).ArticleCASPubMedGoogle Scholar
Lazaridis, I. et al. Ancient human genomes suggest three ancestral populations for present-day Europeans. Nature513, 409–413 (2014).ArticleCASPubMedPubMed CentralGoogle Scholar
Yang, M. A. et al. 40,000-Year-Old Individual from Asia Provides Insight into Early Population Structure in Eurasia. Curr. Biol.27, 3202–3208.e3209 (2017).ArticleCASPubMedPubMed CentralGoogle Scholar
Rieder, M. J., Taylor, S. L., Tobe, V. O. & Nickerson, D. A. Automating the identification of DNA variations using quality-based fluorescence re-sequencing: analysis of the human mitochondrial genome. Nucleic Acids Res.26, 967–973 (1998).ArticleCASPubMedPubMed CentralGoogle Scholar
Delaneau, O., Zagury, J. F., Robinson, M. R., Marchini, J. L. & Dermitzakis, E. T. Accurate, scalable and integrative haplotype estimation. Nat. Commun.10, 5436 (2019).ArticlePubMedPubMed CentralGoogle Scholar
Browning, B. L. & Browning, S. R. Improving the accuracy and efficiency of identity-by-descent detection in population data. Genetics194, 459–471 (2013).ArticlePubMedPubMed CentralGoogle Scholar
Hofmeister, R. J., Ribeiro, D. M., Rubinacci, S. & Delaneau, O. Accurate rare variant phasing of whole-genome and whole-exome sequencing data in the UK Biobank. Nat. Genet.55, 1243–1249 (2023).ArticleCASPubMedPubMed CentralGoogle Scholar
Andrews, R. M. et al. Reanalysis and revision of the Cambridge reference sequence for human mitochondrial DNA. Nat. Genet.23, 147 (1999).ArticleCASPubMedGoogle Scholar
van Oven, M. & Kayser, M. Updated comprehensive phylogenetic tree of global human mitochondrial DNA variation. Hum. Mutat.30, E386–E394 (2009).ArticlePubMedGoogle Scholar
Weissensteiner, H. et al. HaploGrep 2: mitochondrial haplogroup classification in the era of high-throughput sequencing. Nucleic Acids Res44, W58–W63 (2016).ArticleCASPubMedPubMed CentralGoogle Scholar
de Jong, M. J., de Jong, J. F., Hoelzel, A. R. & Janke, A. SambaR: An R package for fast, easy and reproducible population-genetic analyses of biallelic SNP data sets. Mol. Ecol. Resour.21, 1369–1379 (2021).ArticlePubMedGoogle Scholar
Chen, H., Lu, Y., Lu, D. & Xu, S. Y-LineageTracker: a high-throughput analysis framework for Y-chromosomal next-generation sequencing data. BMC Bioinforma.22, 114 (2021).
J.C. Bose Fellowships to B.K.T. (#SR/S2/JCB44/2011 & 2016) and K.T. (JCB/2019/000027) from SERB; CSIR Bhatnagar Fellowship to K.T. (CSIRHRD/BFS2024/03/01); One Time Grant to B.K.T.; and SRF to L.K. from CSIR are gratefully acknowledged.
Author information
Author notes
These authors contributed equally: Anirban Mukhopadhyay, Lomous Kumar.
Authors and Affiliations
Department of Genetics, University of Delhi South Campus, New Delhi, IndiaAnirban Mukhopadhyay, Kiran Sran & B. K. Thelma
CSIR-Centre for Cellular and Molecular Biology, Hyderabad, IndiaLomous Kumar & Kumarasamy Thangaraj
Contributions
B.K.T. and K.T. conceptualised and supervised the study and B.K.T. recruited the study samples. A.M., L.K. and B.K.T. devised the methodology. K.S., A.M. and L.K. genotyped the uniparental markers. A.M. and L.K. performed the data analyses. A.M., L.K. and B.K.T. wrote the first draft of the manuscript. K.T., L.K., A.M. and B.K.T. reviewed the final draft of the manuscript. All authors contributed to and have approved the final manuscript.
Communications Biology thanks Massimo Mezzavilla and the other anonymous reviewer(s) for their contribution to the peer review of this work. Primary Handling Editors: Aylin Bircan, Tobias Goris. A peer review file is available.
Additional information
Publisher’s note Springer Nature remains neutral with regard to jurisdictional claims in published maps and institutional affiliations.
Open Access This article is licensed under a Creative Commons Attribution-NonCommercial-NoDerivatives 4.0 International License, which permits any non-commercial use, sharing, distribution and reproduction in any medium or format, as long as you give appropriate credit to the original author(s) and the source, provide a link to the Creative Commons licence, and indicate if you modified the licensed material. You do not have permission under this licence to share adapted material derived from this article or parts of it. The images or other third party material in this article are included in the article’s Creative Commons licence, unless indicated otherwise in a credit line to the material. If material is not included in the article’s Creative Commons licence and your intended use is not permitted by statutory regulation or exceeds the permitted use, you will need to obtain permission directly from the copyright holder. To view a copy of this licence, visit http://creativecommons.org/licenses/by-nc-nd/4.0/.
source: http://www.nature.com / Nature.com / Home> Communications Biology> Articles / Open Access / May 05th, 2025 / Authors: Anirban Mukhopadhyay, Lomous Kumar, Kiran Sran, Kumarasamy Thangaraj and B K Thelma
A recent study by the Nature Conservation Foundation, in collaboration with owners and managers of agroforests in Hassan and Chikkamagaluru districts, demonstrates the potential of coffee agrosystems as refuge for biodiversity.
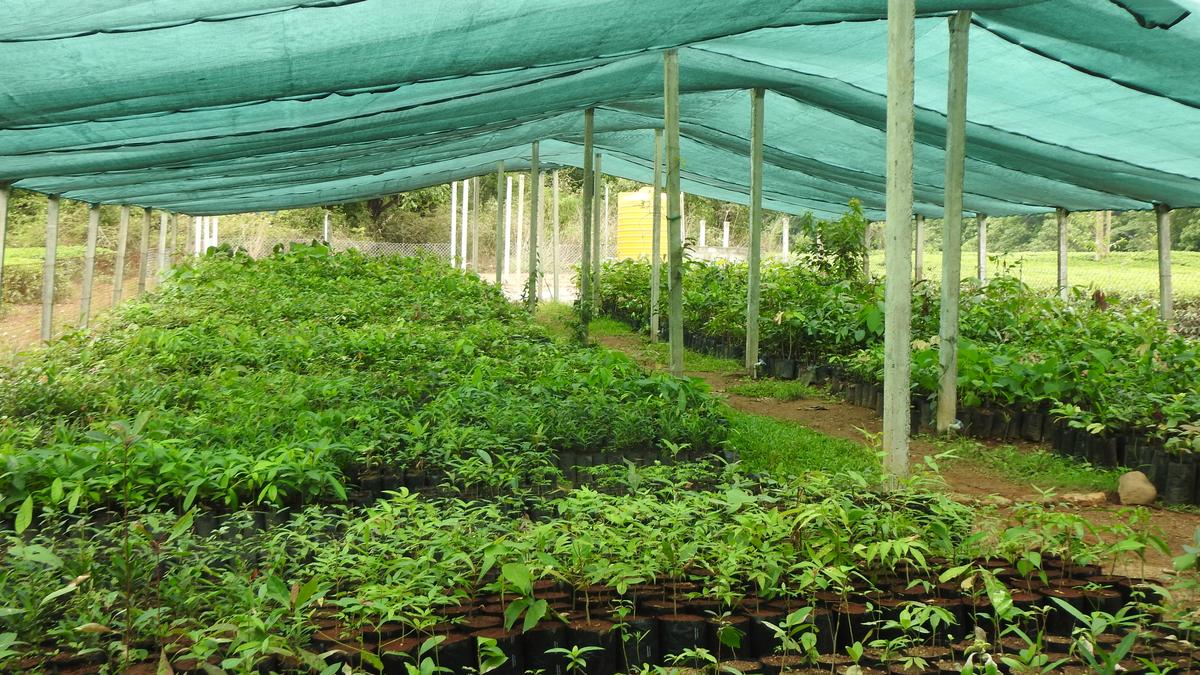
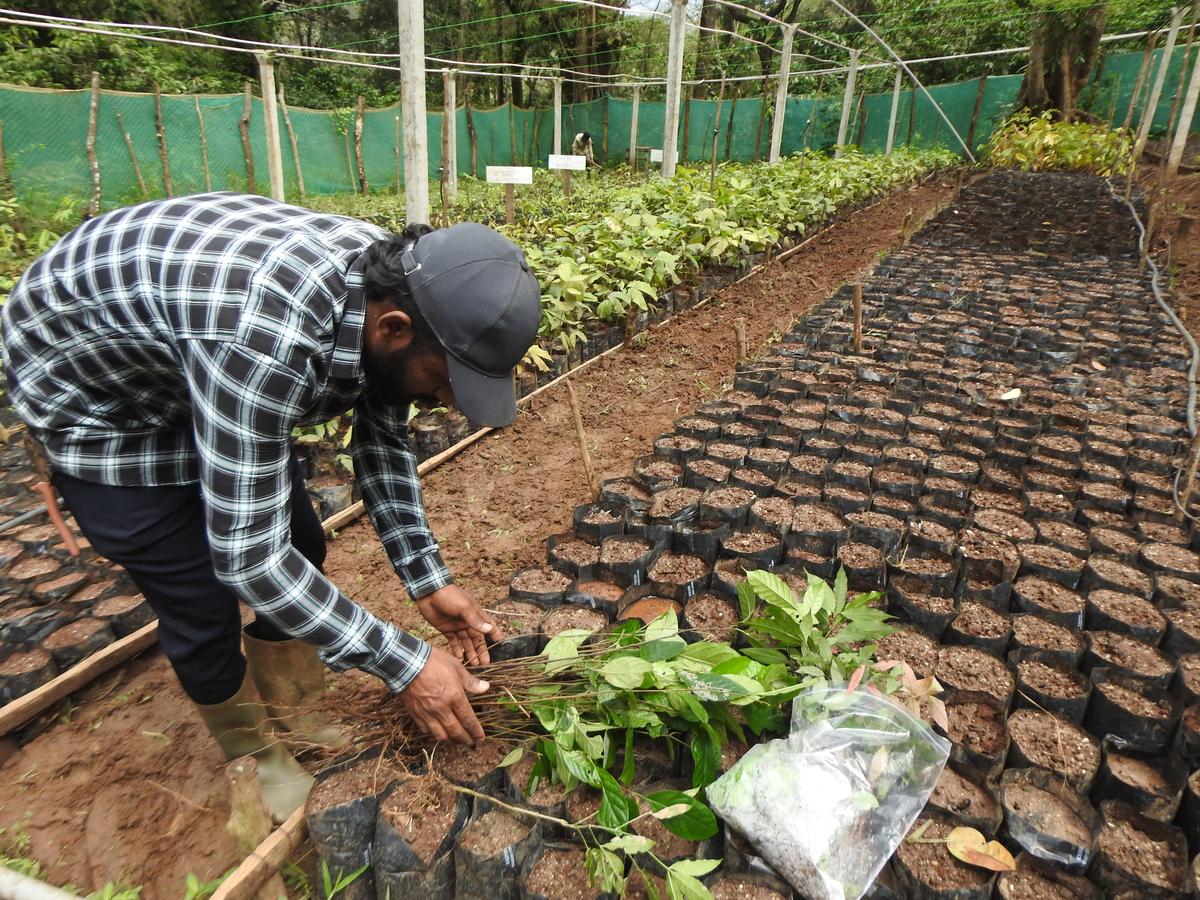
A restoration nursery in the Western Ghats, India. | Photo Credit: Vijay Kumar
In 2019, when the Narmada Estate, a coffee plantation in Karnataka’s Chikkamagaluru district, decided to go organic, it began diversifying the coffee-cropping system to reduce pests. “The reason something becomes a pest is because you have too much of the same thing,” explains Sohan Shetty, the estate’s general manager. “So, we needed to plant as many trees as possible.”
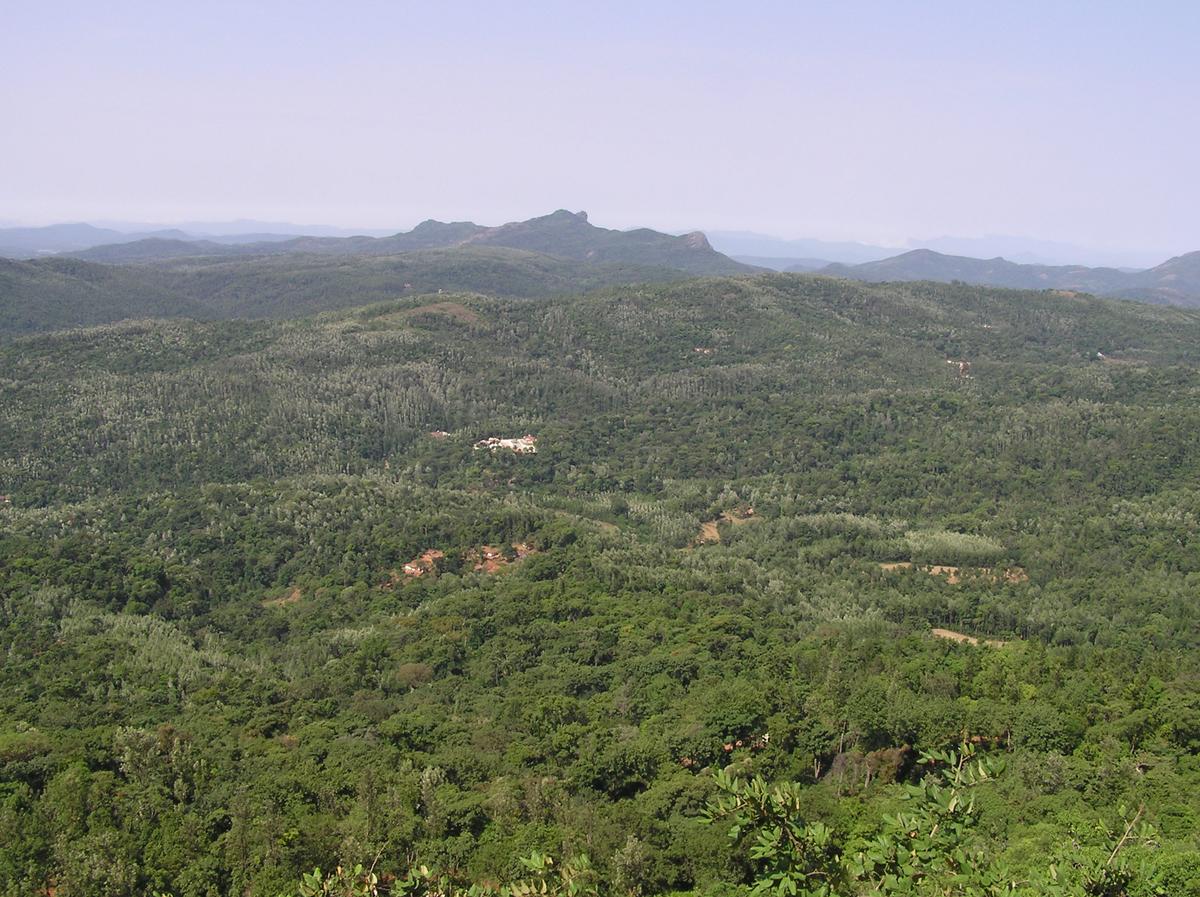
Shade coffee agroforests and pockets of remnant natural forest form a dense and continuous tree canopy in the Chikmagalur region of the Western Ghats, India. | Photo Credit: Anand Osuri
To find suitable plants to grow alongside organic coffee, he began scouting for the best-priced plant sources, including the Karnataka Forest Department’s nurseries and seed suppliers in Chikkaballapur. During his search, Shetty discovered that the Nature Conservation Foundation (NCF) had been actively restoring rainforests in Valparai, Tamil Nadu, for years, and so he reached out to them. “They were amazed at the scale with which I was thinking of starting nurseries and asked me what species I was working on.” So he shared with them the list of trees and seeds available with both the Forest Department and the seed supplier. “The botanist looked at it and said, a week later, that only three of these species are native to the Western Ghats,” he says. “That shook me. I realised that we are just planting trees for the sake of planting trees, but we are completely messing up the ecosystem.”
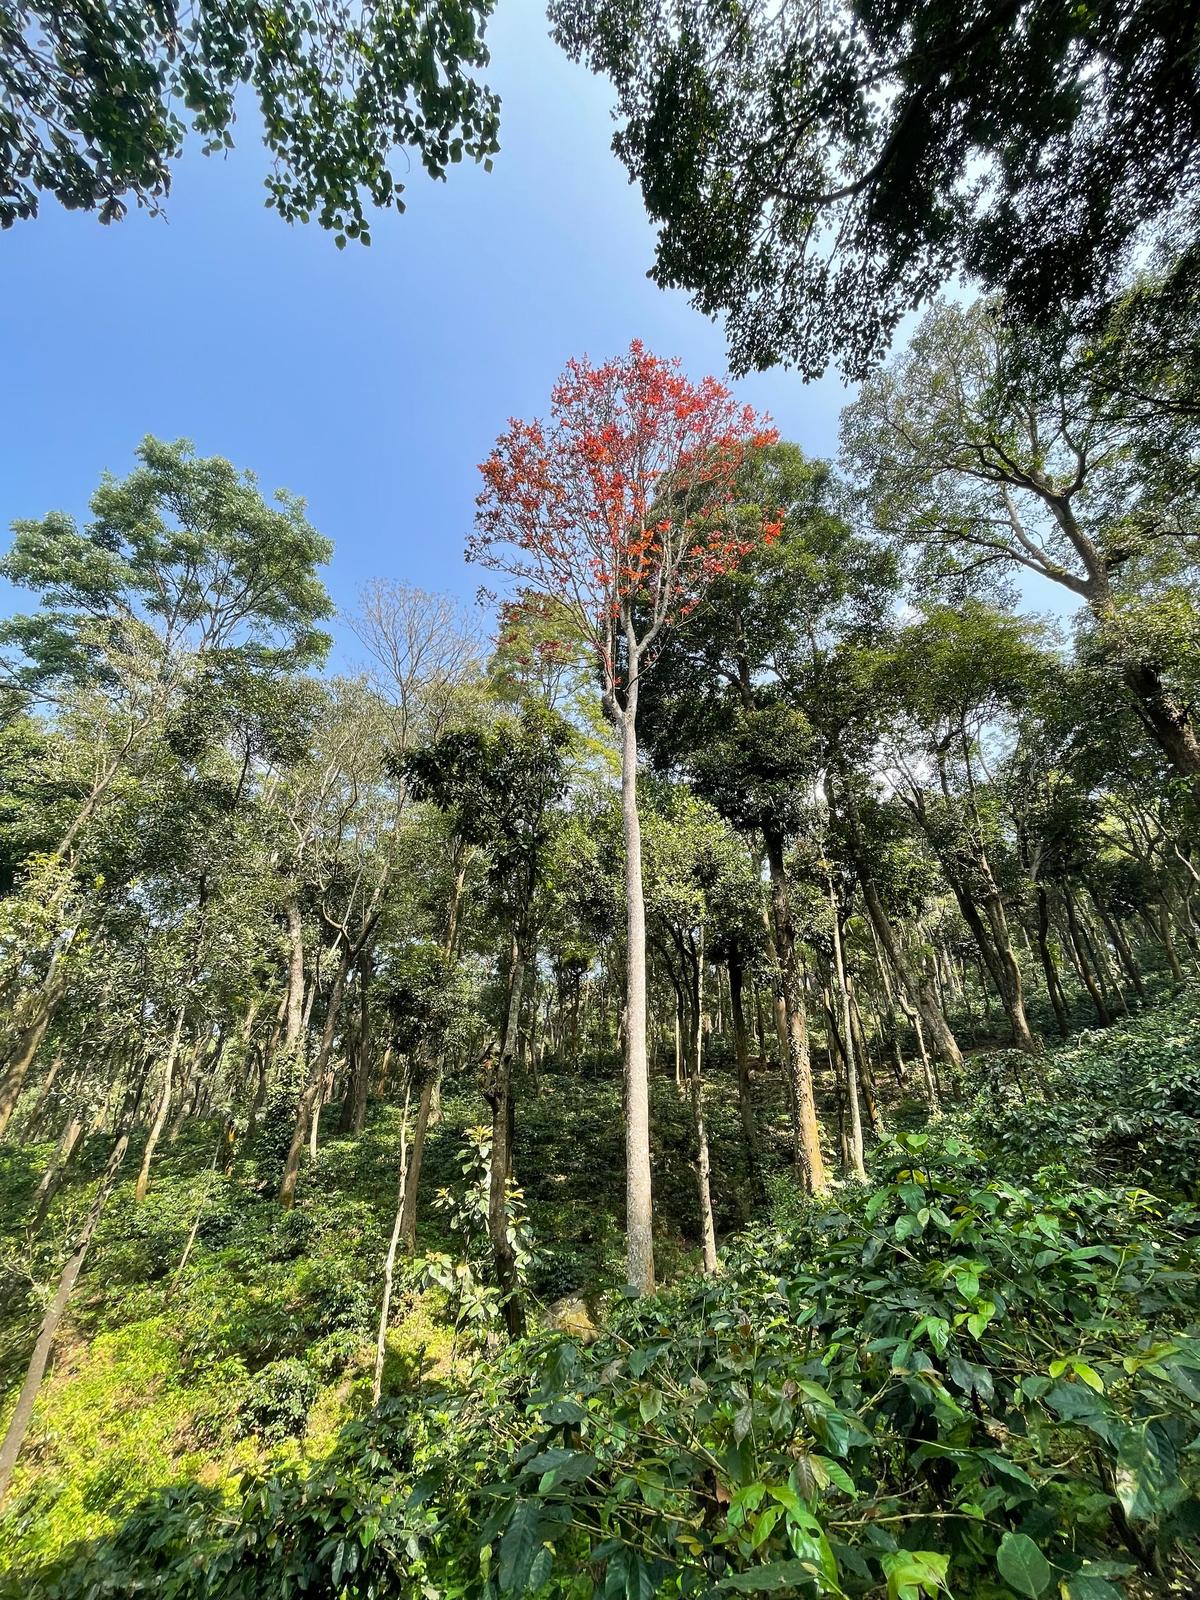
Shade trees in coffee agroforests can comprise a variety of species that are native to forests of the region. The species with fresh red leaves at the center of the image is Canarium strictum, which produces fleshy fruits that attract birds and a resin that is culturally and economically important. | Photo Credit: Vijay Karthick
In search of a better solution, he soon found himself visiting a nursery run by NCF on land allocated by the Kadamane Estates Company in Sakleshpur taluk, Hassan district, which had been set up in 2022. “It was quite impressive, 5000-odd plants of different varieties,” remembers Shetty, who, on seeing this, thought it would be a good idea to further collaborate with NCF. “By that time, I had set up a nursery with 1.2 lakh bags, which could accommodate that many saplings,” he says. “So, I told them that I was happy to grow plants for you. That is how the whole partnership began,” recalls Shetty, who, along with other owners and managers of agroforests in Hassan and Chikkamagaluru districts, was part of a study spearheaded by conservation scientists from the NCF titled Shade coffee agroforests as native plant sources for restoration.
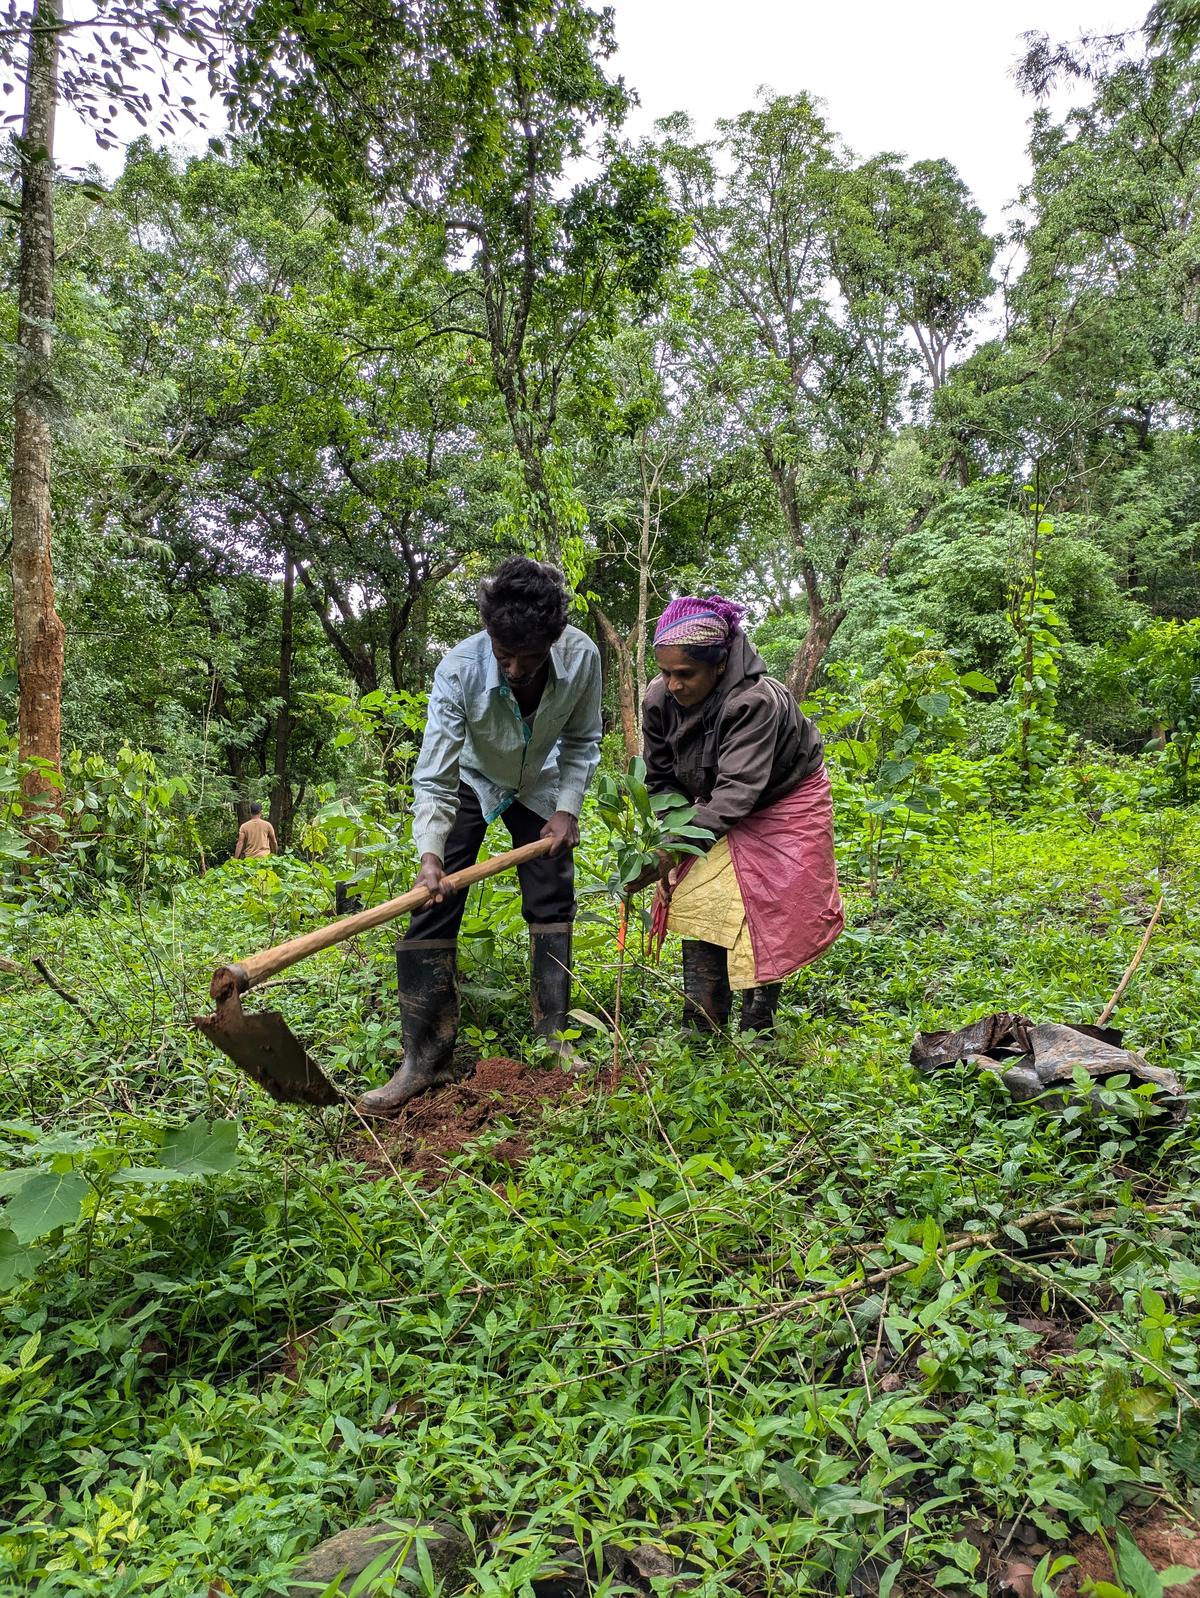
Planting trees as part of ecological restoration in a degraded forest in the Western Ghats, India. | Photo Credit: Vijay Kumar
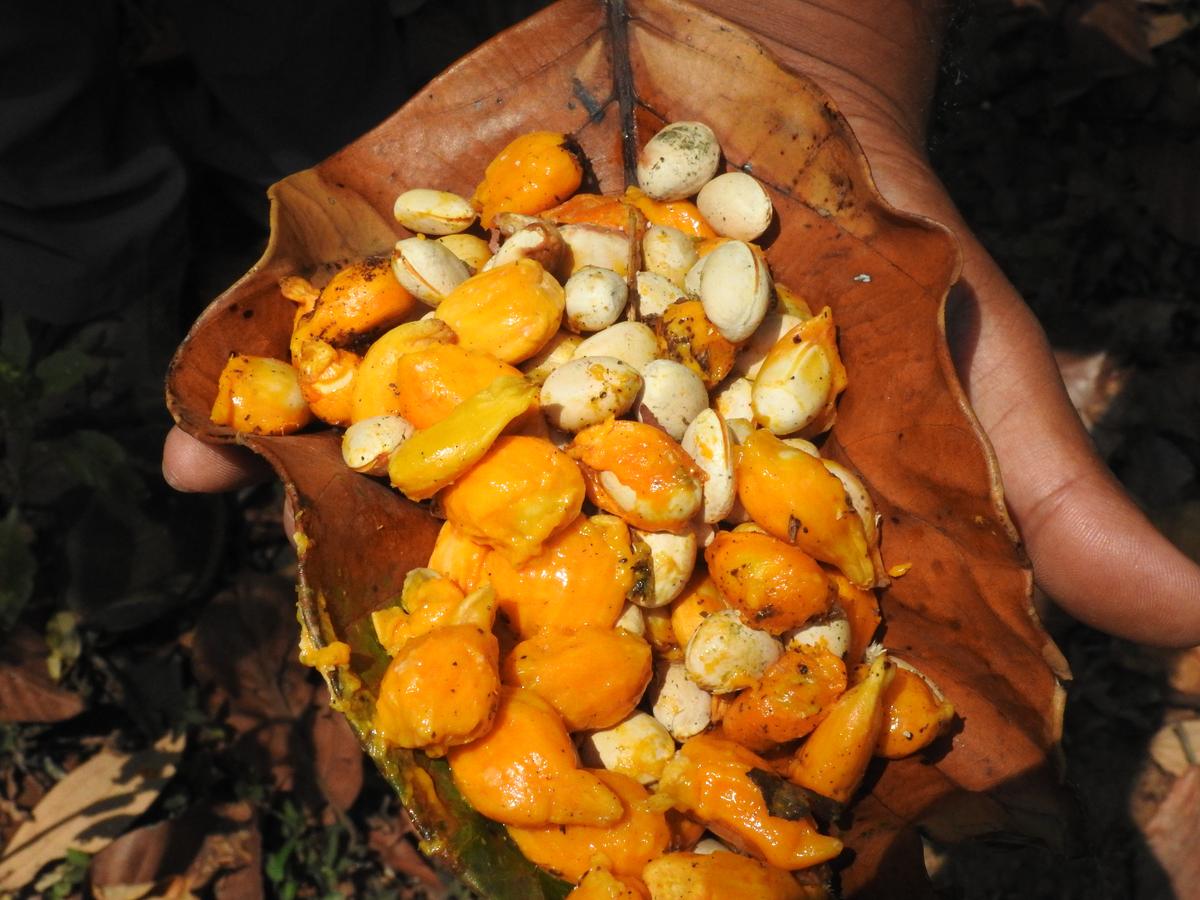
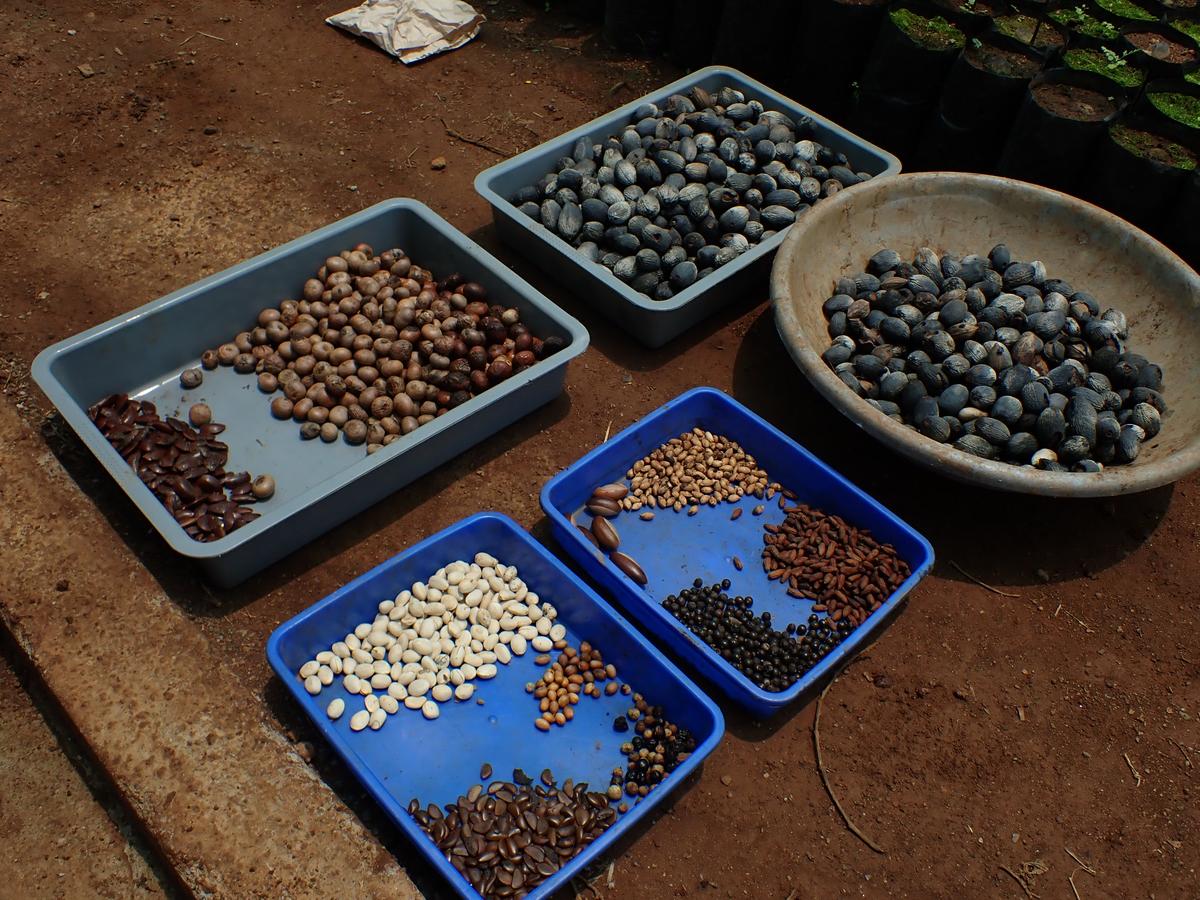
Seed Harvesting
According to Anand Osuri, a scientist with NCF and the paper’s lead author, the study, which has just been published in the Journal of Applied Ecology, really took off in 2023. A year earlier, Vedika Dutta, also a co-author, had come to Osuri as a master’s student, wanting to study birds in coffee agroforests, with a focus on frugivorous or fruit-eating birds. “In the course of her work, we spent time in coffee estates, watching birds and the trees in which they foraged in these coffee plantations,” he says, adding that they were struck by the large numbers and wide variety of native tree seeds and seedlings on the coffee estate floor. “These seeds and seedlings were not just of the trees fruiting overhead, but also other species carried in from further afar by seed-dispersing birds and mammals.”
Around the same time, NCF was also thinking about a forest restoration project in the coffee-growing landscape of the hilly Malnad region by partnering with local residents and landowners. According to him, these landowners had different motivations to restore forests, ranging from an interest in conservation to entering carbon and biodiversity markets or attracting birds to their homestays. “There are a number of opportunities where interested landowners are keen to restore forests in areas where coffee is not being cultivated,” says Osuri, who has been participating in efforts to restore forests for nearly a decade and believes that the availability of diverse native plants, sourced locally and ethically, is critical to do so. “So, there was this restoration project that we were trying to develop, for which we needed to develop native plant nurseries, and the bird work was also going on.”
As part of the restoration project, researchers from NCF needed to collect seeds and seedlings that could be raised in nurseries. But “we didn’t want to be collecting lots of seeds from the forests themselves because that reduces the seed availability there, impacting the resources of animals, birds and insects,” says Osuri. “And so, we put both these pieces together to see if we could do more to harness the potential of coffee farms as a source of seeds for restoration.”
Seeds of Artocarpus hirsutus – a species that is endemic to the Western Ghats (found nowhere else on Earth) – during rescue from a coffee agroforest to a restoration nursery. | Photo Credit: Vedika Dutta
Why coffee
Coffee in India is largely shade-grown, making coffee plantations a potential “refuge for biodiversity,” says Osuri. “For a substantial set of native species important for restoration, we often find adults of those trees in the coffee estates.” However, most seeds that fall and germinate in coffee estates are weeded out because of the possibility of them competing with the coffee bushes for light and other resources, representing a loss for biodiversity conservation. “So, we thought we should make a more systematic effort to rescue their seeds and seedlings before they get weeded out
As part of the study, the team documented the diversity of native tree species found within the coffee estates, recording over 90 native tree species relevant for forest restoration in the region. Clarifying that the word “native”, in this instance, refers to “that particular eco-region of the Western Ghats, the wet evergreen rainforests” and not just plants “native to India,” he says that they were particularly interested in documenting species not only those native to the Western Ghats but also endemic to the region, those “found nowhere else on earth and some of which are classified by the IUCN as being threatened.”
Seeds of multiple native tree species rescued from coffee agroforests prior to sowing at a restoration nursery. | Photo Credit: Vijay Kumar
The NCF team also connected with farmers who were “willing to give us permission to visit their farms, collect seeds, and also, in the monsoon season, collect small seedlings which were growing along the roadside.” Between 2023 and 2024, around 18,000 seeds and seedlings of 56 native tree species were rescued and are currently being raised in the two restoration nurseries established through collaborations between NCF and agroforest owners. “We are trying to encourage and enable people to take up such projects to plant the right native species in the right places.”
Currently, the restoration project is in a pilot stage with the NCF team focusing on two collaborative initiatives: expanding the network of seed source coffee farms and developing more native plant nurseries. “The idea we are proposing is that we should not just view coffee agroforests as refuges for biodiversity, but also acknowledge their potential to contribute to conservation in the wider landscape by being a source of native plants for restoration.”
Seedlings of multiple native tree species rescued from coffee agroforests prior to replanting at a restoration nursery. | Photo Credit: Vijay Kumar
Future potential
In Osuri’s opinion, more collaborations and experimentation are now needed. “A few more things will need to be worked out before one can talk about substantially scaling up, since, at the moment, one of the limiting factors is nursery resources,” he says. One potential partner, who can play a key role in expansion, he believes, is the Karnataka Forest Department. “We plan to discuss our findings with department officers to see if there is a workable model for this,” he says. “If we can develop models for connecting seed sources in coffee farms with nurseries of the forest department, then the scale and potential really go up because the department already has an excellent network of nurseries.”
Osuri also hopes to strengthen and scale up their efforts in the Malenadu region, since nearly 70% of India’s coffee production comes from the Malenadu region, mainly from the Baba Budan Hills in Chikkamagaluru to Kodagu in the south. ”This is also an important region for biodiversity conservation and restoration,” he says. His long-term goal is to continue to explore opportunities and collaborate with coffee farmers and landowners for restoration, experiment with different approaches to restoration, and contribute in any other way he can to biodiversity in the region, he says.“And we would love to connect and exchange learnings with others interested in exploring similar models in different landscapes.”
source: http://www.thehindu.com / The Hindu / Home> News> Cities> Bengaluru / by Preeti Zachariah / May 05th, 2025
WELCOME. If you like what you see "SUBSCRIBE via EMAIL" to receive FREE regular UPDATES.
Read More »